What an Indian degree pays
Aggregate analysis of public government survey microdata (MoSPI PLFS). No Avanti student data and no personally identifiable information: every figure is a weighted population share, a cell count or a percentile of reported earnings.
From the government’s own labour force survey, PLFS CY2025. 57.8 million degree holders aged 21–34, 65,485 of them surveyed. August 2026.
Of every hundred Indians aged 21–34 holding an undergraduate degree, twenty are in formal work — regular salaried, with a contract or social security. The other eighty are self-employed, working informally, studying, unemployed, or out of the labour force entirely.
Forty are working for money at all. Eleven are in postgraduate study. The remaining forty-nine are doing neither — 28 million graduates.
Which degree you hold moves the formal-work figure by a factor of three and a half. It barely changes what happens to your wages once you are in work.
The six qualifications
Section titled “The six qualifications”| Population | Share | Formal work | Informal salaried | Self-employed | Studying | Unemployed | Domestic duties | |
|---|---|---|---|---|---|---|---|---|
| Engineering degree | 5.42m | 9.4% | 52.6% | 3.7% | 7.8% | 6.0% | 15.5% | 7.8% |
| Technical diploma * | 2.02m | 3.5% | 36.3% | 8.7% | 9.9% | 11.9% | 14.6% | 7.1% |
| Medical degree | 0.85m | 1.5% | 32.4% | 12.7% | 10.8% | 18.8% | 8.5% | 10.5% |
| Other technical degree | 2.27m | 3.9% | 24.8% | 7.1% | 8.3% | 13.0% | 17.9% | 16.2% |
| Other diploma * | 1.82m | 3.2% | 23.1% | 8.6% | 11.5% | 10.7% | 14.1% | 19.5% |
| Other degree | 45.42m | 78.6% | 15.0% | 7.6% | 10.8% | 11.9% | 11.5% | 26.0% |
Rows don’t sum to 100. Casual wage labour is inside the informal-salaried column, not outside it — an earlier version of this sentence said otherwise and was wrong. What sits outside: unpaid family workers, self-employed reporting no positive earnings, rentiers and those unable to work. The section below partitions the same people three ways with nothing left over.
* These two rows are mislabelled and are not diploma holders. They are gedu_lvl='12' — people
who hold a degree and additionally a diploma, 4,496 of them. India’s actual diploma population is
gedu_lvl='11', 6.91 million people, and it is absent from this analysis entirely. It is covered
properly in ../, where a technical diploma
reaches 30.77% formal employment. Corrected there rather than here because this document is merged;
do not quote these two rows.
Nearly four in five degree holders are in the bottom row. “Other degree” is every B.A., B.Sc., B.Com. and B.B.A. in India — 45 million people, of whom 15% have a formal job. That single row is the Indian graduate labour market. It is also, unavoidably, a black box: PLFS records only technical and professional qualifications, so arts, science and commerce cannot be told apart.
Two different ways of not working. Engineering and other-technical graduates have the highest unemployment — 15.5% and 17.9%, actively looking. Other-degree holders have the highest domestic duties — 26.0%, outside the labour force. Technical graduates queue for jobs; general graduates leave the queue. Adding these into a single “not working” figure hides the distinction that matters.
What a completed degree actually leads to
Section titled “What a completed degree actually leads to”Three categories, mutually exclusive, summing to 100. No composite indicator, no definitional argument: someone who already holds a degree and is recorded as studying is in postgraduate study, which is the cleanest available measure of progression.
| Working for money | Studying (PG) | Neither | Completed a PG | |
|---|---|---|---|---|
| Engineering degree | 64.7% | 6.0% | 29.2% | 13.1% |
| Technical diploma | 56.2% | 11.9% | 31.9% | 17.2% |
| Medical degree | 55.9% | 18.8% | 25.3% | 19.0% |
| Other diploma | 44.7% | 10.7% | 44.6% | 29.6% |
| Other technical degree | 41.3% | 13.0% | 45.6% | 41.9% |
| Other degree | 35.6% | 11.9% | 52.5% | 18.0% |
| All graduates | 39.9% | 11.4% | 48.7% | 19.3% |
Two in five graduates are earning anything at all. For the other-degree bucket — 45 million people, four in five of all Indian graduates — it is one in three, and more than half are doing neither.
“Neither” is not all involuntary. It holds both the unemployed who are actively looking and those in domestic duties who are not, and the balance differs sharply by bucket: engineering is 15.5% unemployed against 7.8% domestic, other-degree is 11.5% against 26.0%. Technical graduates queue for jobs; general graduates leave the queue. The per-bucket sections split it out.
Studying and having finished are different things. The last column counts those who already hold a postgraduate degree, and it runs from 13.1% of engineering graduates to 41.9% of other-technical-degree holders. That threefold spread matters for the wage tables below, which cover graduates only: for engineering they describe 86.9% of the bucket, for other technical degrees just 58.1%. The buckets are not selected the same way.
What they earn, and how it grows
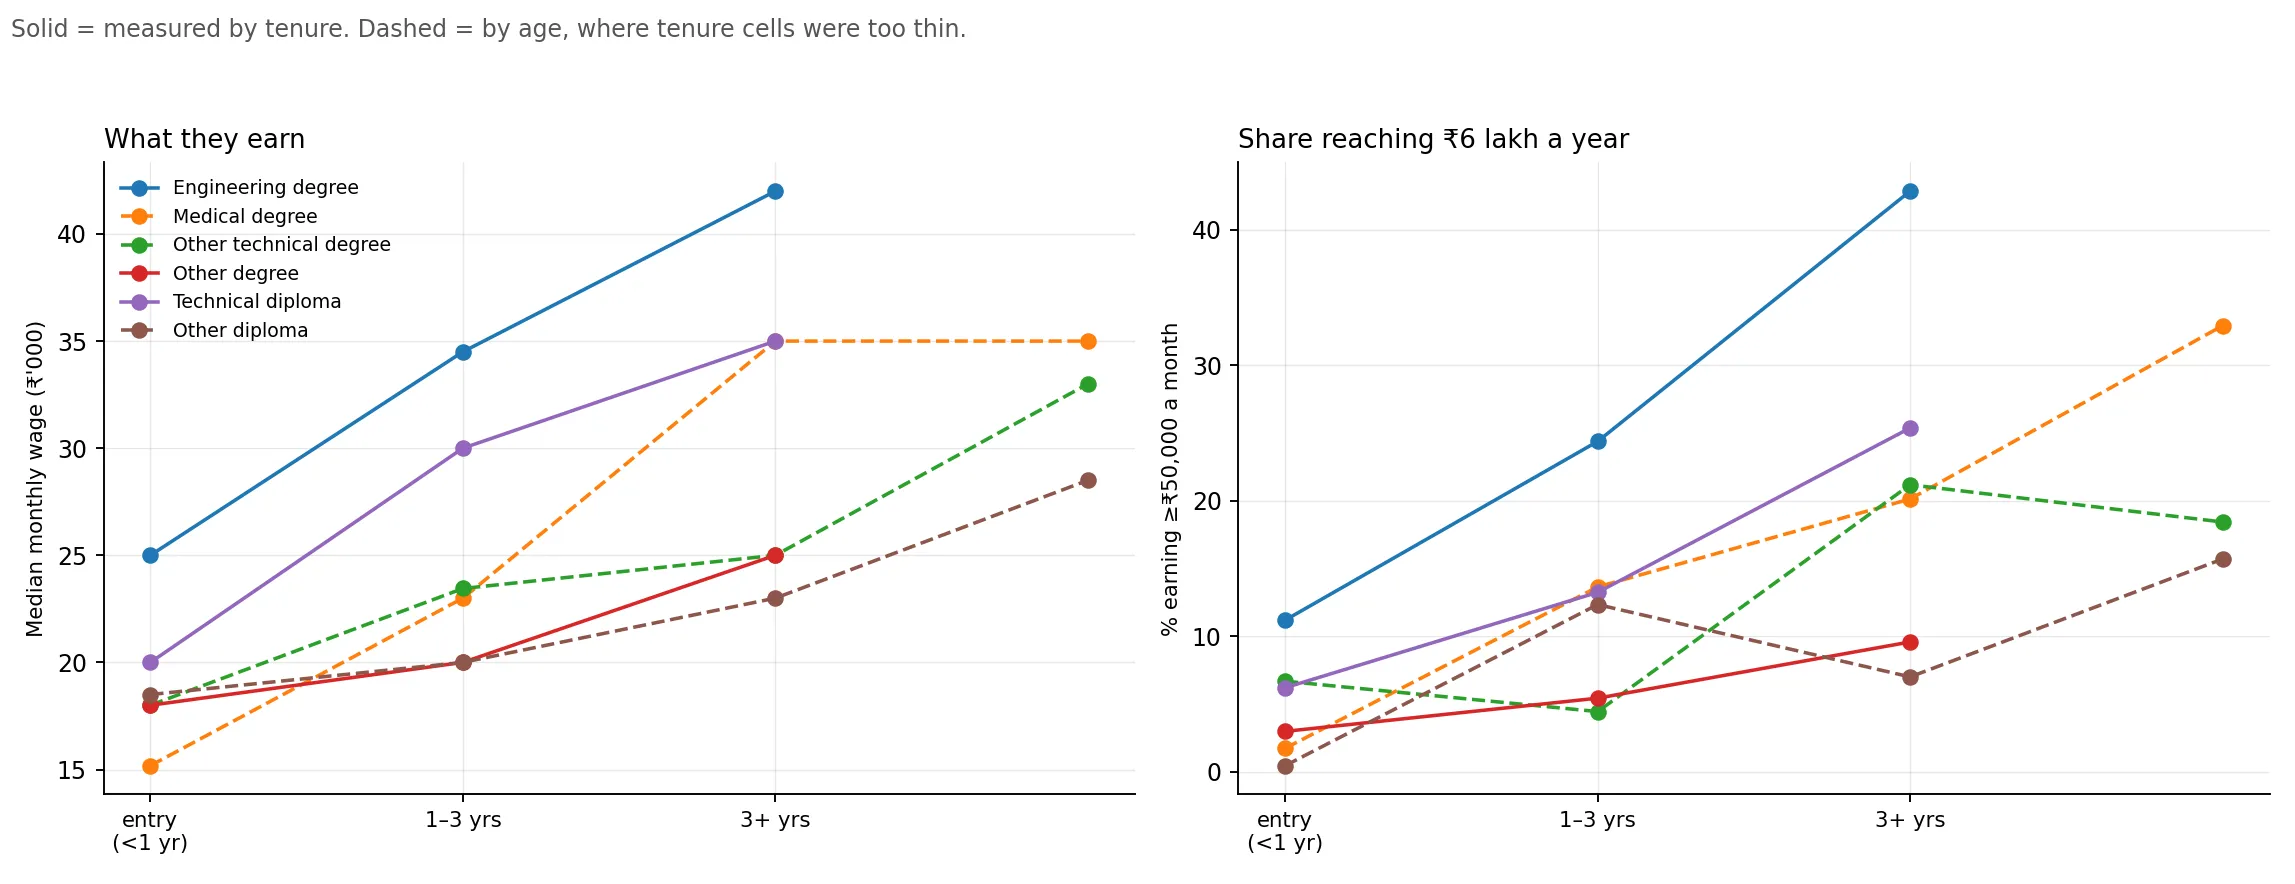
Section titled “What they earn, and how it grows”Monthly wage in formal work. Growth is measured by tenure — time in the present activity status — wherever the sample allows, because tenure measures time in work directly instead of assuming when someone graduated. Three buckets fall back to age bands — medical (entry tenure cell n=43), other technical (n=47) and other diploma (n=45), all below the n≥50 threshold the method sets. Their rows are marked and are measured on age; the other three use tenure.
| At entry (<1 yr) | 3+ years | Growth | n at entry | |
|---|---|---|---|---|
| Technical diploma | ₹20,000 | ₹35,000 | 1.75× | 74 |
| Engineering degree | ₹25,000 | ₹42,000 | 1.68× | 182 |
| Other technical degree (age lens) | ₹18,000 | ₹33,000 | 1.83× | 51 |
| Medical degree (age lens) | ₹15,180 | ₹35,000 | 2.31× | 40 |
| Other degree | ₹18,000 | ₹25,000 | 1.39× | 699 |
| Other diploma (age lens) | ₹18,500 | ₹28,500 | 1.54× | 33 |
Within graduates the growth multiple is broadly similar — 1.39× to 1.75× over the first three-plus years. An engineering degree does not buy dramatically faster growth than a technical diploma. It buys a higher starting wage and, far more importantly, a much better chance of having a wage at all.
That similarity is a fact about graduates, not about education generally. Extended down the
whole education ladder it breaks completely: below middle school the median wage does not grow at
all over three years. See ../.
The share clearing ₹50,000 a month tells the same story from the other end:
| At entry | 3+ years | |
|---|---|---|
| Engineering degree | 11.2% | 42.9% |
| Technical diploma | 6.2% | 25.4% |
| Medical degree (age lens) | 1.7% | 32.9% |
| Other technical degree (age lens) | 6.7% | 18.4% |
| Other diploma (age lens) | 0.5% | 15.7% |
| Other degree | 3.0% | 9.6% |
Move the line
Section titled “Move the line”₹50,000 a month is one threshold, not a fact of nature. output/wage_threshold_grid.csv holds the
exact weighted share above every threshold from ₹15,000 to ₹150,000, for every bucket and every
step, so the line can be moved without rerunning anything.
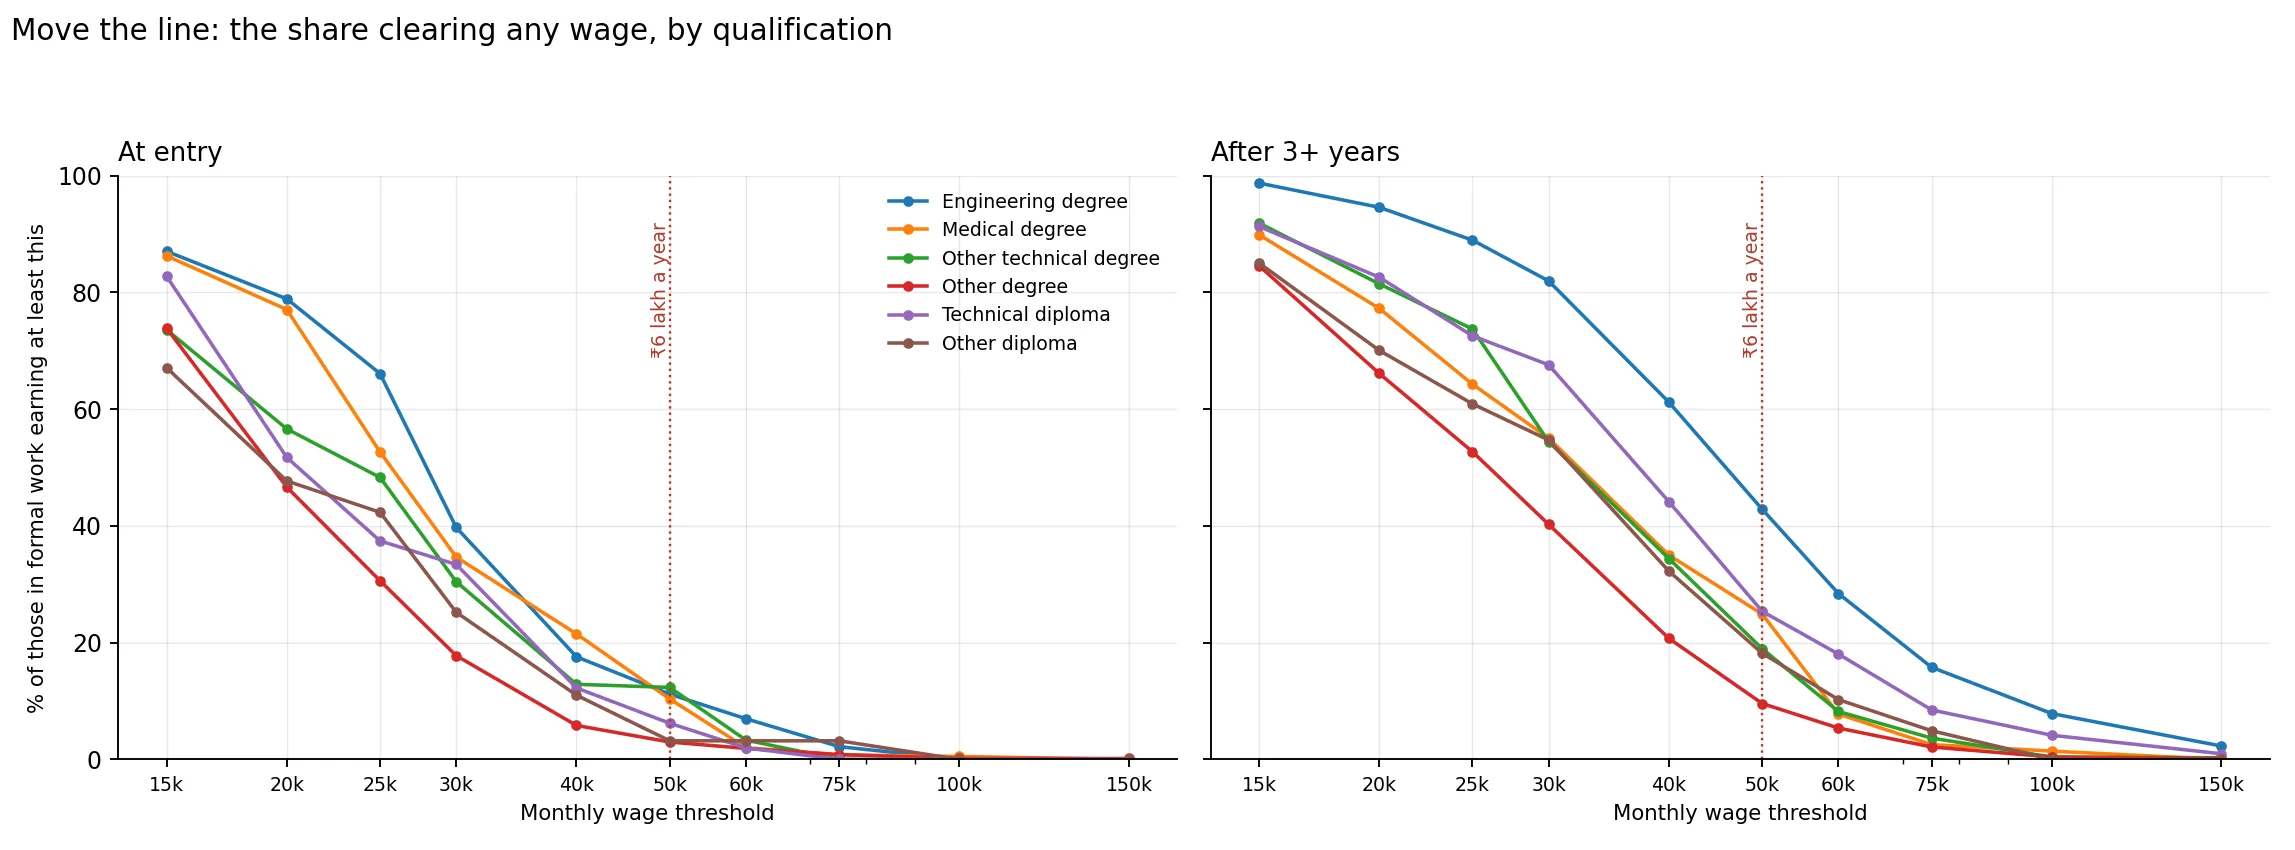
At entry the six qualifications are nearly indistinguishable above ₹50,000 — everyone is between 3% and 15%. By three years in they fan out, and engineering separates decisively. The premium is not paid at hiring. It accrues.
Method
Section titled “Method”The chain
Section titled “The chain”PLFS CY2025, first visit only (usual principal activity is collected only at V1), aged 21–34.
The employment and wage tables cover graduates (gedu_lvl='12'). Postgraduates
(gedu_lvl='13') are held out of those, because mixing a fresh graduate’s wage with a
postgraduate’s would confound the qualification with the extra years. They are brought back in for
the NEET and progression section, which is the only way to see how many of each bucket continued
and therefore how selected the graduate-only tables are.
Formal work is regular salaried (pas='31') with positive earnings and either a written
contract (job_pas 2–4) or social security (ssec_pas not 8 or 9). Informal earning is reported
alongside and never merged in: it is real work, but a different labour market.
The three-way split replaced a NEET cut. NEET bundles “unemployed and looking”, “at home”,
“unpaid family labour” and “cannot work” into one number whose value depends on which employment
convention you adopt, and its training leg cannot be measured in PLFS at all — voc records how a
skill was acquired ever, not whether someone is in training now, and trg is undocumented and
populated for 27% of the sample. The split says the same thing without the definitional argument.
Working for money is regular salaried with earnings, or self-employed with earnings, or casual
wage labour. Casual labour is counted without an earnings test: ern_reg and ern_self cover
only regular and self-employed work, so of 1,286 casual labourers just 12 carry an earnings value,
and requiring one would drop them for a reason about survey coverage rather than their work. They
are 2% of the sample either way. Unpaid family helpers are excluded — PLFS records them as
employed, they earn nothing, so they sit in “neither”.
Buckets come from tedu_lvl, PLFS’s only field-of-study variable. Degrees split into
engineering, medical, other technical (agriculture, crafts, other subjects) and “other degree”
('01', no technical qualification). Diplomas split into technical and other, at both graduate
and below-graduate level.
Tenure, and why it is the better lens
Section titled “Tenure, and why it is the better lens”dur_pas records duration in the present principal activity status. Its five codes are not
documented in our schema, so they were validated against people who cannot have long tenure: among
graduates in salaried work, code 3 peaks at age 22–23, code 4 at 25, code 5 from 27. That is the
standard NSS ladder — under 6 months, 6–12 months, 1–2 years, 2–3 years, 3+ years — and the
boundaries are inferred from that fit rather than read from a codebook.
Collapsed to three steps, because five leaves under 50 people in the entry cell for four of six
buckets. A bucket earns the tenure lens only if every step clears 50; otherwise it falls back
to age. That rule is applied mechanically in build.py and the choice is printed for each bucket.
Two caveats. Tenure measures time in the activity status, not with an employer — changing jobs while staying salaried keeps the clock running. And it is blank for anyone not working, so it says nothing about the unemployed.
The threshold grid, and one thing that did not work
Section titled “The threshold grid, and one thing that did not work”The share above each threshold is computed exactly, from weighted survey data. A log-normal was also fitted to every cell so intermediate values could be interpolated — and then checked against the exact shares before being used:
| Threshold | ₹15k | ₹20k | ₹25k | ₹30k | ₹40k | ₹50k | ₹60k | ₹100k |
|---|---|---|---|---|---|---|---|---|
| Mean absolute error (pp) | 3.4 | 3.3 | 4.1 | 4.6 | 2.9 | 2.1 | 1.4 | 0.7 |
The fit fails at low thresholds, by up to 14.9 percentage points. Reported wages heap on round
numbers — ₹15,000, ₹20,000, ₹25,000 — and those are exactly where the low thresholds sit; a smooth
curve cannot reproduce a spike. So the slider reads the empirical grid, and share_above()
refuses to return a number below ₹15,000 rather than returning a bad one. The fit is used only
above ₹40,000, and only to extrapolate past the top of the grid.
One finding worth carrying elsewhere: the fit sits below the true share at ₹50,000 in 29 of 42 cells. The real right tail is fatter than log-normal. Any analysis that models Indian salary distributions as log-normal is understating the top.
Robustness: pooling four years
Section titled “Robustness: pooling four years”The engineering figures rest on a ₹6 lakh cell of 34 people, so the whole analysis was re-run
across calendar_2022–calendar_2025 as a separate check — POOLED.md.
| Basis | n | ≥₹6L cell | In formal work | Formal and ≥₹6L | 95% CI |
|---|---|---|---|---|---|
| CY2025 only (headline) | 1,042 | 34 | 34.65% | 4.42% | [2.19, 7.19] |
| Pooled, deflated to 2025 | 2,338 | 91 | 35.96% | 5.59% | [3.82, 7.61] |
It confirms the headline and buys a 26% tighter interval. Every version sits inside every other’s interval. Formal employment is stable at 32–39% across all four years with no trend. The ≥₹6L series year to year — 2.97%, 6.12%, 8.41%, 4.42% — is noise on cells of 13 to 34 people and supports no claim about wages improving or worsening over the period.
CY2025 stays the headline because the pooled figure is no longer current: it averages a labour market before and after whatever changed.
Two things that check found, both of which matter beyond the robustness question:
- The
annual_*releases overlap thecalendar_*ones.annual_2022_23spans July 2022 to June 2023, two calendar releases. Pooling both series would count the same survey periods twice. - Wages must not be deflated on the median. It reads exactly ₹15,000 in three consecutive years — the same round-number heaping that breaks the log-normal fit — which would have assumed away all nominal growth. The mean rises 14.5% over the period and is used instead.
What this does not tell you
Section titled “What this does not tell you”No causation. People who study engineering differ from people who study B.A. in ways this cannot see. The gap describes who holds which jobs, not what produced them.
No subject detail for 79% of graduates. Arts, science and commerce are one bucket because PLFS does not distinguish them.
Medical is thin — 885 people, 43 in the entry tenure cell, which is why it uses age bands. Read it as indicative.
Nominal wages, one year. CY2025 only; no deflation, no trend. Pooling CY2022–25 would roughly quadruple the thin cells but needs a price adjustment first, and is deliberately not done here.
The wage tables exclude postgraduates, who are 13% to 42% of a bucket. Where progression is high the remaining graduates are a more selected group, and that selection is not the same across buckets.
Clustered sampling. PLFS is stratified multi-stage; treating people as independent understates standard errors by a factor of 3.5–4.7. The tables here carry point estimates. Anything leaning on a small cell should be bootstrapped over first-stage units.
| File | What |
|---|---|
ENGINEERING.md |
Engineering worked end to end — how the age window was chosen, every definition, all sample sizes |
extract.sql |
Wage distribution by bucket × lens × step |
check_entry_wage.py |
Bootstrapped check that the age window is not contaminated by longer-tenure workers |
POOLED.md · extract_pooled.sql · pooled_engineering.py |
Robustness check: the whole thing re-run across four PLFS years |
extract_employment.sql |
Employment outcomes by bucket × age band |
extract_activity.sql |
Working / studying / neither, by bucket × age band |
build.py |
Tables, the fit check, share_above(), both charts |
output/wage_threshold_grid.csv |
The slider — share above every threshold |
output/lognormal_fit_check.csv |
Fitted vs exact, per cell and threshold |
output/earnings_by_bucket.csv · employment_by_bucket.csv · activity_split.csv |
The extracts |
Rebuild:
bq query --use_legacy_sql=false --format=csv --max_rows=100000 < extract.sql > output/earnings_by_bucket.csvbq query --use_legacy_sql=false --format=csv --max_rows=100000 < extract_employment.sql > output/employment_by_bucket.csvbq query --use_legacy_sql=false --format=csv --max_rows=100000 < extract_activity.sql > output/activity_split.csvpython3 build.py
# robustness: the same analysis pooled across calendar_2022-2025python3 pooled_engineering.py
This analysis stands alone and uses no NIRF data. It is intended to be read on its own, and to be combined with the separate NIRF college analysis in a later piece.