The lost middle
79% of young Indians aged 25 to 34 have no regular salaried job. Changing that needs a thoughtful repurposing of the general undergraduate degree, and a recalibration of what government jobs ask for.
Section titled “79% of young Indians aged 25 to 34 have no regular salaried job. Changing that needs a thoughtful repurposing of the general undergraduate degree, and a recalibration of what government jobs ask for.”Draft v3, 13 September 2026. Avanti Fellows. Written from the government’s own household survey (the Periodic Labour Force Survey, 2018-19 to 2025), the AICTE, AISHE, NMC and UDISE+ registers, and a reading of the research and press. Rewritten in plain language after a claim-by-claim test against the data [1], four outside critiques [2] and a debate between five people who would have to act on it [3]. Earlier drafts are in the file history.
📄 Download as PDF — 28 pages, figures included.
Executive summary
Section titled “Executive summary”1. Four in five young Indians have no regular salaried job. Of the 18.7 crore people aged 25 to 34, 79% have no regular salaried job and 88% have none with a written contract or social security. Only 5.4% hold one paying the ₹25,000 a month they say they are aiming at. The unemployment rate is 3.4%, and that is why the problem is invisible: almost everyone else is working. They are self-employed, on daily wages, or helping in a family business. A third of the age group, almost all women, is at home and not looking for work. The paper counts those two situations separately all the way through. [4,5,6]
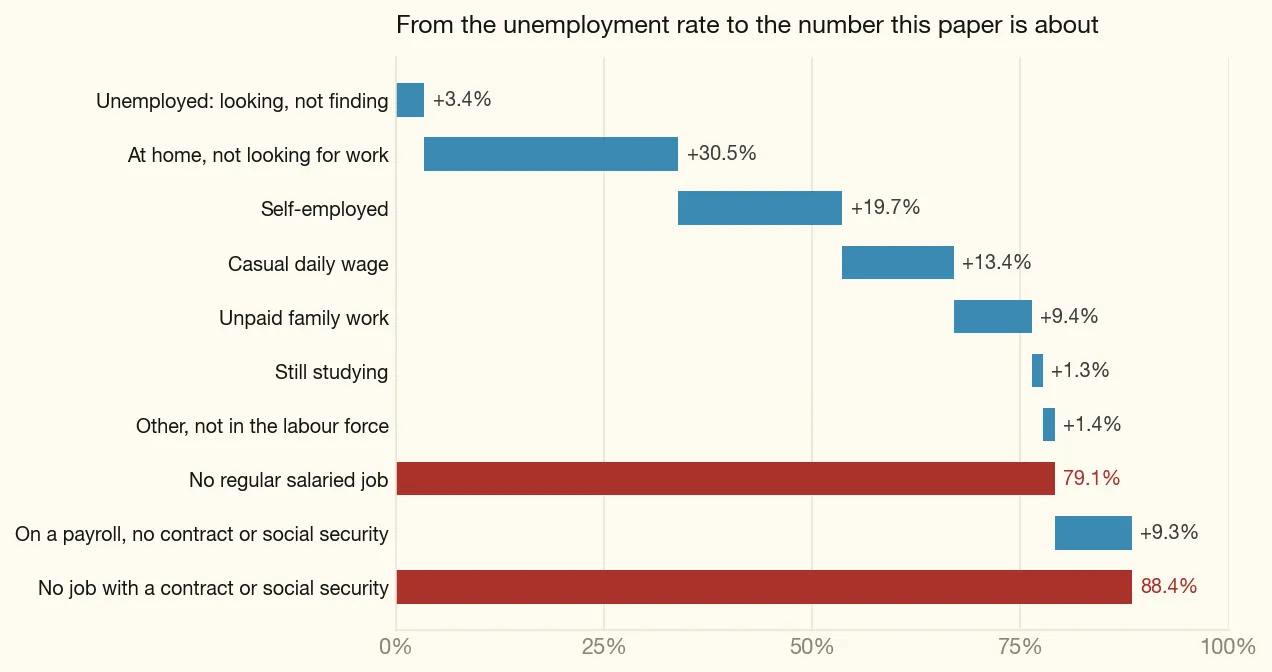
Figure 1. From the quoted unemployment rate to the number this paper is about. Everyone aged 25 to 34, PLFS calendar 2025. The two dark bars are running totals, not additions.
2. Two different groups, and the policy money goes to only one of them. Of the people actively looking for work, more than half hold a BA, BCom or BSc and a quarter more hold a diploma or a technical degree: only one in nine stopped at or before Class 10. Of the much larger group with no regular salaried job at all, it is the other way round: 44% never passed Class 10 and another 14% stopped there. The first group is educated and searching. The second is mostly working, just not on a payroll. Almost every rupee of skilling money is aimed at the second. [7]
3. Most of the people without a regular job are self-employed, and almost none of that is enterprise. 19.7% of the age group works for itself and another 9.4% works unpaid in a family business, so the two together outnumber everyone in a regular salaried job. Of 9.1 crore self-employed people aged 25 to 44, 8.3 crore work alone and 76 lakh employ anybody. Half of the working-alone half is farming at ₹9,500 a month; farming, craft, shopkeeping and driving are 87.5% of it and pay ₹9,500 to ₹16,000. Everything paying more than ₹20,000 is under 5% of it put together. Working alone pays about what a salary pays for someone who left school at Class 10, and much less for a graduate: ₹16,000 against ₹20,000 at 25 to 34, and ₹20,000 against ₹30,000 by 35 to 44. [8,9,10]
4. For the Class 10 leaver, the money in Industrial Training Institutes buys work but not wages, and that is the whole problem with it. Someone aged 25 to 34 who finished school and took full-time trade training earned a median ₹12,700 a month in 2018-19 and ₹16,000 in 2025. Prices rose 39% over those years, so a 26% rise is a real-terms fall of about 10%, and it is the slowest rise of any qualification in the survey. [11] Someone with the same schooling and no training went from ₹10,000 to ₹15,000, so the reward for doing the training has shrunk from ₹2,700 a month to ₹1,000. [12] The certificate still does one real thing: it roughly doubles the chance of being on a payroll rather than a daily wage, and doubles the chance of a contract and social security. It does not raise the pay, and ₹16,000 is well short of what a young person from a family without money is aiming at. [13]
5. Graduates are already buying trade training themselves, and it gets them work but not better pay. The government’s own tracer study of ITI pass-outs finds 54% had already finished Class 12 before joining, and another 7% held a degree. [14] They are not being sent; they are going, because it works for finding a job. At ages 35 to 40 a general graduate with training is in a regular salaried job 52% of the time against 35% without, and in a government job 22% against 13%. The gap holds inside every band of household spending, so this is not just richer families doing both. [15,16] The pay is nearly the same, ₹28,000 against ₹25,000. Same shape as the ITI: more formality, no more money. The exception is worth naming because it is the best case for trade training in this paper: among men doing own-account craft work, formal training is worth ₹18,000 a month against ₹16,000 without, twice what the same certificate is worth on a payroll. It reaches 4.3% of them, and the 93.7% without it learned the trade from family or on the job. [17]
6. At the top, the picture is clear and small. Engineering and medicine together take about 3% of each cohort; all professional degrees together take 5%. [18] There is a surplus of engineering seats and a shortage of good ones: a third sit empty in both government and private colleges. [19] Nothing of any size is being done about the government colleges that underperform. The only central scheme for them, MERITE, is ₹4,200 crore over five years, and it was budgeted at ₹300 crore in its second year. [20,21] The money should go to funding the good government colleges properly, filling their teaching posts, and making the subsidy a poor student already carries work as hard in a government college as it does in a private one, rather than to more seats. [15,22]
7. The largest destination after school is the general degree, and on its own it is the weakest route there is past school. BA, BCom and BSc graduates and postgraduates are about a third of everyone who reached Class 10, which is 43 lakh people in each cohort. [18] A general degree with no training of any kind puts a person aged 35 to 40 in a regular salaried job 35% of the time at ₹25,000 a month, the lowest share and close to the lowest pay of any route past school, below every other degree and almost every diploma. [15] Only about one general graduate in ten has any vocational training at all. [18]
8. Two routes in the middle do better, and both are tiny. A polytechnic diploma, the three-year diploma entered after Class 10, puts a person aged 35 to 40 in a regular salaried job 59% of the time at ₹28,000, against 35% and ₹25,000 for a general degree alone. A post-degree diploma does better again, 58% at ₹35,000 and 74% at ₹55,000 for the engineering kind. [15] Neither is level with an engineering degree, which is 75% at ₹52,000. What they offer is a much better chance of a payroll from a far cheaper start. Between them they reach about 8 lakh people of each cohort against 43 lakh general graduates. The polytechnic is not an urban route, which matters for whether it can scale: 44% of diploma holders live in towns, about the same as general graduates at 46%, while the post-degree diploma is the urban one at 56%. [18,22,23]
9. What these young people are actually aiming at is a government job, and that door is closing. More than half say so: 65% in 2016, 55% in 2021. [24] It is a reasonable aim, and the survey shows why. A government job pays a median ₹30,000 a month against ₹15,000 in private salaried work, and that two-to-one ratio has held every year since 2018-19. Government still provides 55% of every job in the country paying ₹50,000 a month or more. It matters most where these young people live: it is 29% of salaried work in rural India against 21% in towns. [25] Add that government pay starts at ₹35,400 for a junior engineer, that general graduates hold 23% of all government jobs, and that for Scheduled Caste, Scheduled Tribe and Other Backward Class families a reserved post is a claim the law gives them, which no private employer owes. [26,27] A degree is the way in to almost all of it. But between 2018-19 and 2025 government jobs held by people aged 25 to 54 grew 10% while all regular salaried jobs grew 35%. Government’s share of regular salaried work fell from 30% to 24%, and the share of its own staff aged 25 to 34 fell from 33% to 30%. The employer this whole group is aiming at has stopped hiring at the rate it once did. [28]
10. The route with the best evidence behind it is running half empty, and no scheme is aimed at it. 59% of polytechnics are private, government holds about 35% of approved diploma intake, seats run a third to a half empty and enrolment is falling. [29,30] The empty seats are not where the students are: diploma seats are 33 to 35% full in Tamil Nadu, Punjab and Rajasthan and 71 to 77% full in Bihar, Odisha and Kerala, with a quarter of all the empty seats in Tamil Nadu alone. [31] A government polytechnic at ₹8,000 a year also competes against a private engineering degree that costs an eligible poor student nothing, because the state reimburses that fee. [32,33] Central money for polytechnics is 100 institutions inside MERITE’s ₹4,200 crore. [20] Section 12 is about this.
11. So the fix is not to send graduates to an ITI. It is to build for the middle. Two halves: repurpose the general undergraduate degree so it carries a real trade qualification, and recalibrate what government jobs ask for so the qualifications below a degree open posts worth having, while government fills the posts it already has. Eight recommendations follow in section 13, costed at roughly ₹13,000 to ₹14,000 crore over five years, none of it taken from ITI budgets, on unit costs now computed from the published pay scales and the government’s own hostel norm. [34] Only one of the eight needs a new instrument: the rest extend schemes that already exist, which is the fastest way to move and the reason the total is small. In plain terms they are:
- Pay for teachers. The Centre funds new permanent teaching posts in government polytechnics and engineering colleges for five years, released against appointment letters. ₹9,000 to ₹10,000 crore over five years, and everything else fails without it.
- Let the scholarship follow the student. Fee reimbursement and the Post-Matric Scholarship should pay for a government diploma on the same terms as a private degree. A reallocation, about ₹120 to ₹150 crore a year.
- Put a trade inside every BA, BCom and BSc. A 300 to 600 hour practical module taught by the district’s ITI or polytechnic, examined outside, credited to the degree. ₹150 crore in year one.
- Make the diploma count in government recruitment. Let a three-year diploma meet the qualification bar wherever a post asks for a degree but the work is technical, and reserve a fifth of junior engineer recruitment for diploma apprentices. Costs nothing.
- Run PM-SETU as designed and take nothing from it. Verify employment institution by institution, and tie the outcome payments to pay rather than to employment at any wage.
- Build only where the seats are full. Second shifts, new trades replacing dead ones, hostels for women, in states running at 70% or better. No new campuses. ₹1,500 crore over five years.
- Count payroll records, not placement claims. Link provident fund records to every technical graduate, published institution by institution. ₹50 crore.
- Fix the exam calendar. A binding annual schedule and vacancy count for the recruitment commissions. The only item that shortens the wait itself.
1. Who has a job, and who does not
Section titled “1. Who has a job, and who does not”The survey asks what a person mainly did over the past year. At ages 25 to 29 the answers, for 9.8 crore people, are these, and the same shares hold almost unchanged at 30 to 34: [4]
| Everyone | Men | Women | |
|---|---|---|---|
| Working in some form | 60% | 90% | 31% |
| In a regular salaried job | 21% | 33% | 9% |
| In a job with a contract or social security | 11% | 17% | 6% |
| Looking for work and not finding it | 5% | 6% | 4% |
| At home, not looking | 32% | 0.3% | 62% |
At ages 30 to 34 almost nothing moves: men 34% in a regular salaried job, women 10%.
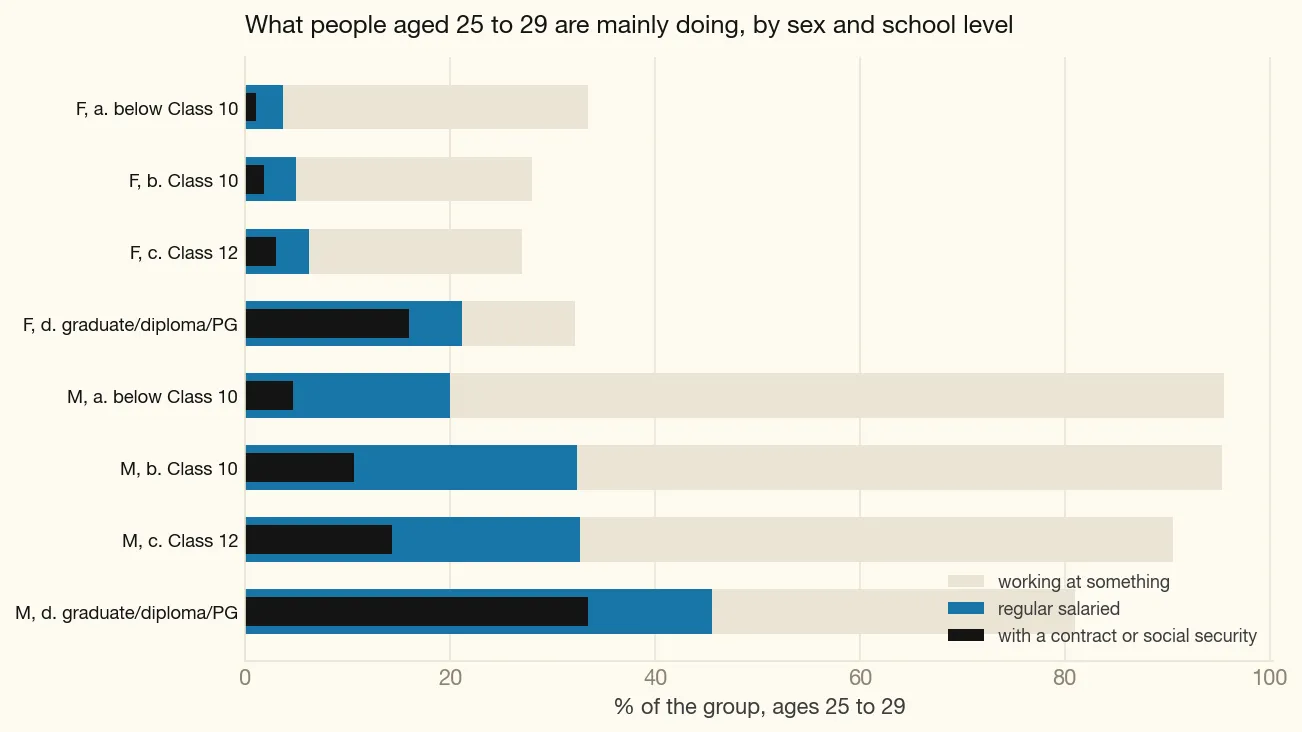
Figure 2. What people aged 25 to 29 are mainly doing, by sex and school level. Each bar is the whole group; the darkest segment is a job with a contract or social security.
Unemployment is not the problem here. “Unemployed” in the survey means looking for work and not finding it, which is 5% at 25 to 29 and 2% at 30 to 34. Most of the people who are working are self-employed, on daily wages, or helping in a family business. Two in three men aged 25 to 34 have no regular salaried job at all.
Men and women have to be counted separately. Six in ten women aged 25 to 29 are at home and not looking for work. That is a large fact and a different one. Any single number that mixes it with men’s joblessness will be misread. Everything below reports men separately, and says so where women’s numbers are quoted.
Half the regular salaried jobs are not the job anyone is aiming at. Only half of men’s regular salaried jobs come with a written contract or any social security, which puts the tighter measure at 17% of all men aged 25 to 29. Add the ₹25,000 a month a young person from a family without money says they are aiming at, and the number gets much smaller: 5.4% of everyone aged 25 to 29 holds a regular salaried job paying that much, roughly one person in eighteen. Age does not fix it. The share peaks at 6.6% at ages 30 to 34 and is back to 5.4% by 45 to 54, so people are not queueing for these jobs and then getting them. [5]
2. Where most young people actually go
Section titled “2. Where most young people actually go”Per cohort of 2.5 crore born in a year, by where they finally stop: [18]
| Lakh | Share | |
|---|---|---|
| Never passed Class 10 | 97 | 39% |
| Class 10 | 33 | 13% |
| Class 12 | 41 | 16% |
| BA / BCom / BSc | 43 | 17% |
| General postgraduate | 11 | 4.5% |
| Nursing, pharmacy, teacher training and other sub-degree diplomas | 5.0 | 2.0% |
| Polytechnic diploma | 3.6 | 1.4% |
| Post-degree diploma | 3.3 | 1.3% |
| Engineering degree | 6.8 | 2.7% |
| Medicine and the health cluster | 1.3 | 0.5% |
| B.Ed, law, MBA and other professional degrees | 4.2 | 1.7% |
Two-thirds of each cohort stops at school. Of the third that goes further, seven in ten take a general degree. Every technical and vocational route put together, meaning polytechnics, post-degree diplomas, engineering, medicine and nursing, is smaller than a tenth of the cohort.
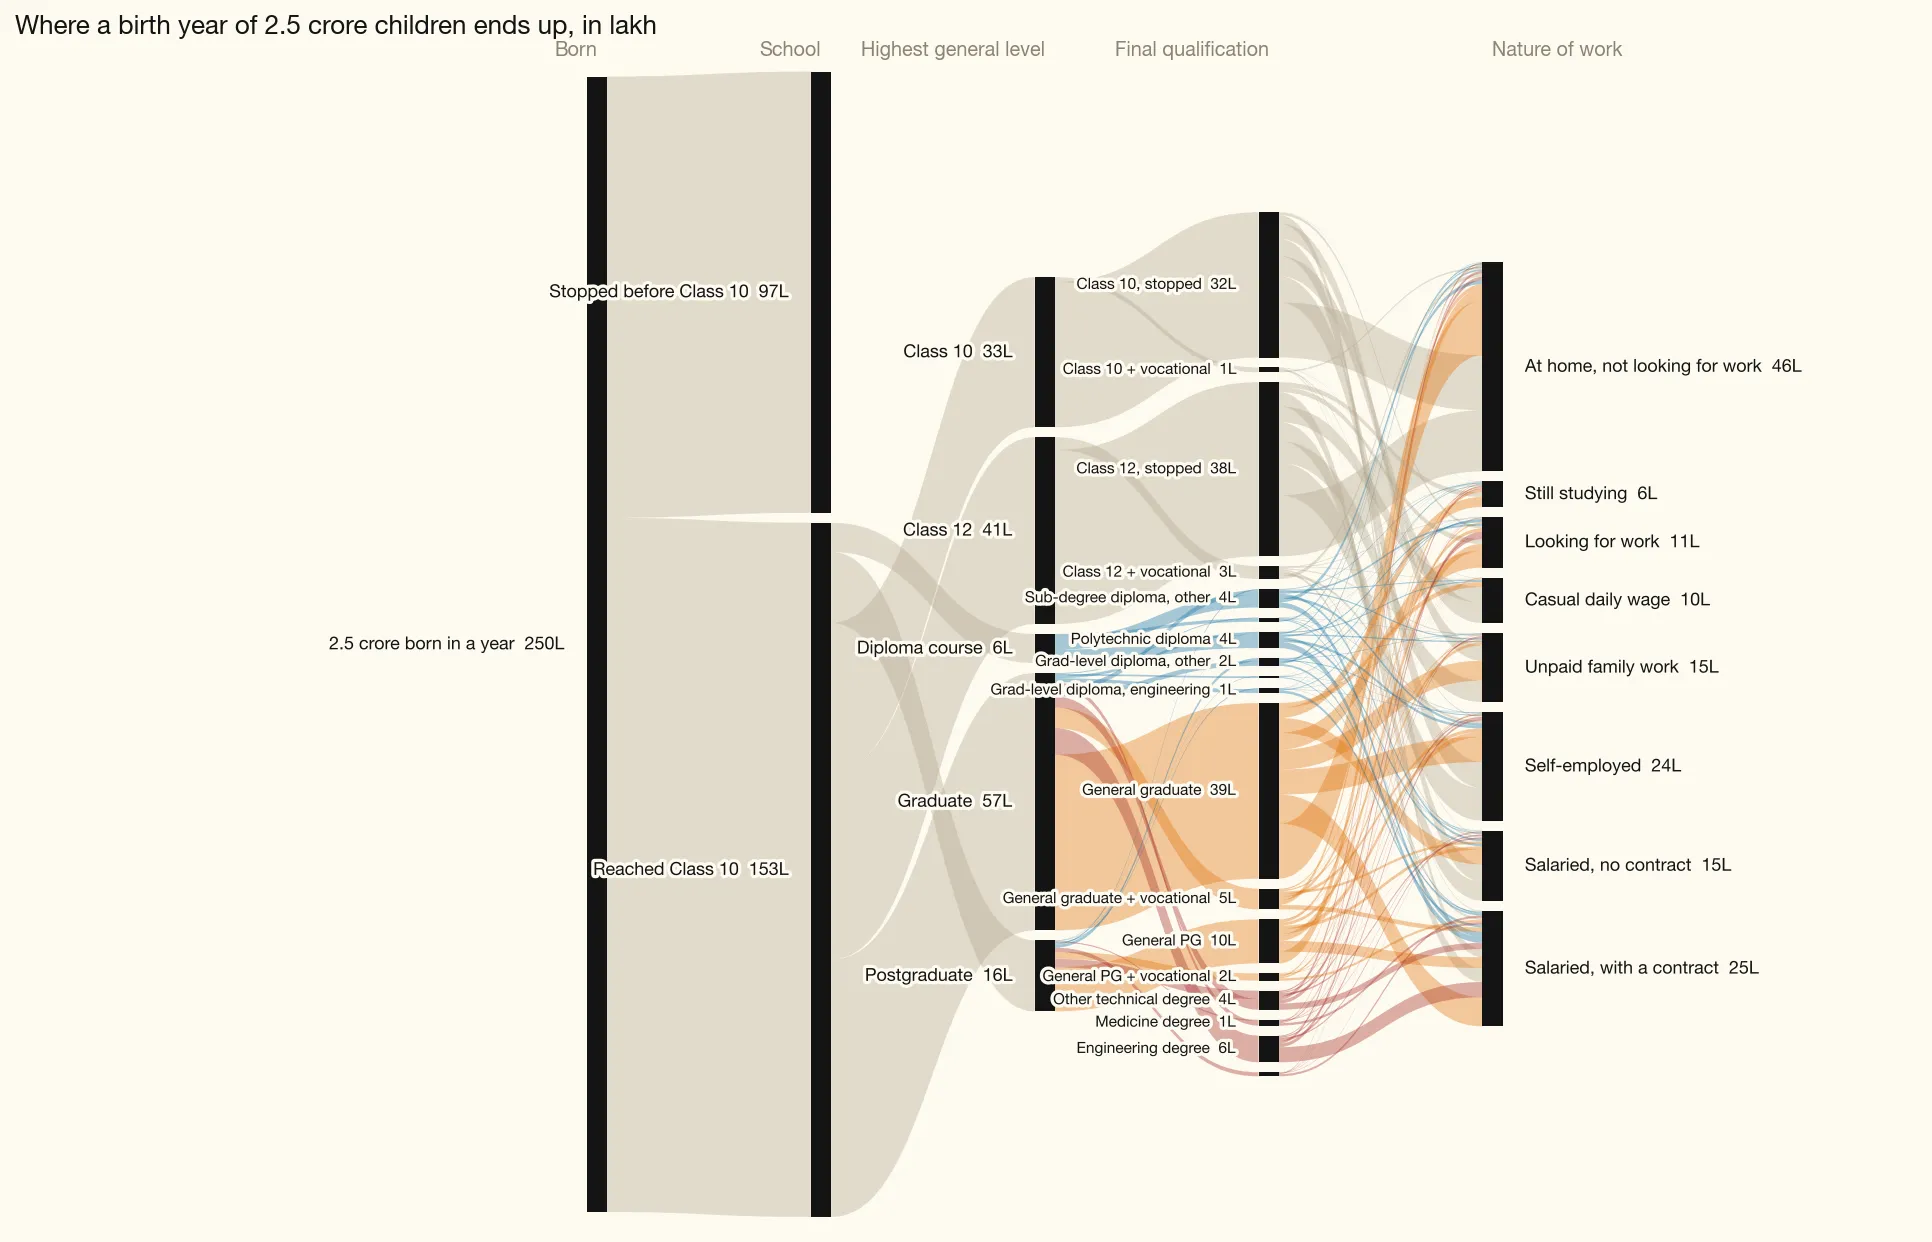
Figure 3. Where a birth year of 2.5 crore children ends up, in lakh. Flows are coloured by qualification family. Final-qualification nodes under one lakh are drawn but not labelled; the table below lists all eighteen.
3. Who the people without regular jobs are
Section titled “3. Who the people without regular jobs are”Two populations are hiding inside the same statistic. [7]
| School level | Share of everyone 25–29 | Share of those without a regular salaried job | Share of those looking for work |
|---|---|---|---|
| Never passed Class 10 | 39% | 44% | 6% |
| Class 10 | 13% | 14% | 5% |
| Class 12 | 16% | 17% | 11% |
| Diploma or technical degree | 10% | 6% | 25% |
| BA / BCom / BSc or postgraduate | 22% | 20% | 53% |
Read the middle column first. More than half the people without a regular salaried job never got past Class 10. They are mostly working, in farming, construction, small shops and daily wage work, just not on a payroll. This is who the ITI system was built for.
Now read the last column. Three-quarters of the people actively looking for work hold a degree or a diploma. They are not in the first group at all. They are qualified, they are searching, and they are the ones sitting in coaching towns writing government exams.
A policy aimed at one of these groups will not touch the other. Most of the confusion in this debate comes from treating them as one group.
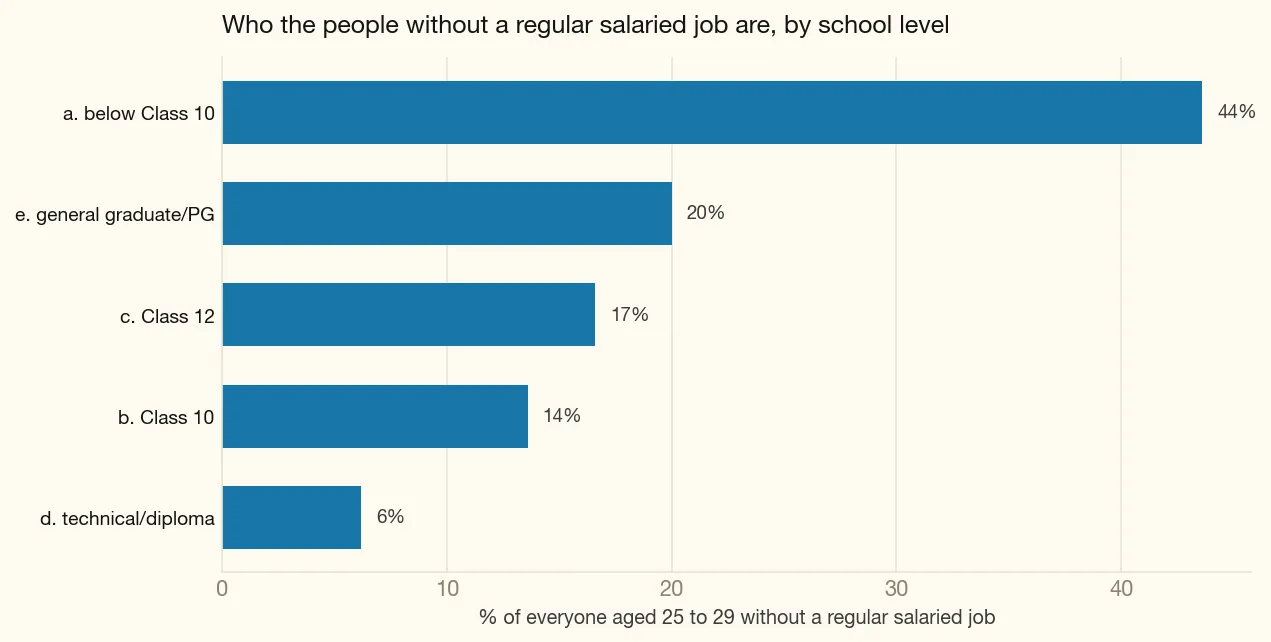
Figure 4. Who the people without a regular salaried job actually are, by the school level they reached.
4. What the people without a regular job are actually doing
Section titled “4. What the people without a regular job are actually doing”Most of them are working. 19.7% of everyone aged 25 to 34 is self-employed and another 9.4% works unpaid in a family business, so the two together are 29% of the age group against 20.9% in a regular salaried job. Self-employment is the larger destination, and until this draft the paper had nothing to say about it. [4,8]
It thins out as qualifications rise, slowly. At ages 25 to 34, 21% of people who never passed Class 10 are self-employed, 22% of those who stopped at Class 10 or 12, 16% of general graduates and 10% of engineering graduates. A general graduate is nearly as likely to be self-employed or helping in a family business (25%) as to hold a regular salaried job (30%). [8]
Working for yourself pays about what a salary pays at the bottom, and much less at the top. The median self-employed earner against the median regular salaried earner of the same qualification, ages 25 to 34: below Class 10, ₹11,200 against ₹12,000; Class 10, ₹13,500 against ₹15,000; Class 12, ₹15,000 against ₹15,000; general degree, ₹16,000 against ₹20,000; engineering degree, ₹30,000 against ₹40,000. By 35 to 44 the gap at the bottom closes to nothing and the gap at the top widens: a general graduate working for themselves earns ₹20,000 against a salaried ₹30,000. [8] For someone who left school at Class 10, working for yourself is not the worse option. For a graduate it is, and increasingly so with age.
Two thirds of it is one thing: own-account work, which is working alone. The survey separates people who employ someone from people who do not. Of 9.1 crore self-employed people aged 25 to 44, 8.3 crore work alone and 76 lakh employ anybody, a ratio of eleven to one. The difference in what they earn is larger than any qualification gap in this paper. A general graduate working alone earns a median ₹16,000; a general graduate who employs someone earns ₹35,000, which is above the salaried median at every age. Pooled, the two produce a number that flatters what almost all self-employed graduates actually live on. [9]
Half of own-account work is farming, and the parts that pay are a rounding error. Own-account workers aged 25 to 44, by what they do: [10]
| People | Share | Median a month | |
|---|---|---|---|
| Farming and animal rearing | 394 lakh | 47.7% | ₹9,500 |
| Craft and trades | 136 lakh | 16.5% | ₹12,000 |
| Shop and street selling | 123 lakh | 14.8% | ₹15,000 |
| Driving | 70 lakh | 8.5% | ₹16,000 |
| Managers | 16 lakh | 2.0% | ₹22,500 |
| Agents, brokers and admin associates | 11 lakh | 1.3% | ₹25,000 |
| Other professionals | 7 lakh | 0.9% | ₹25,000 |
| Technicians: science, health and IT | 2 lakh | 0.3% | ₹25,000 |
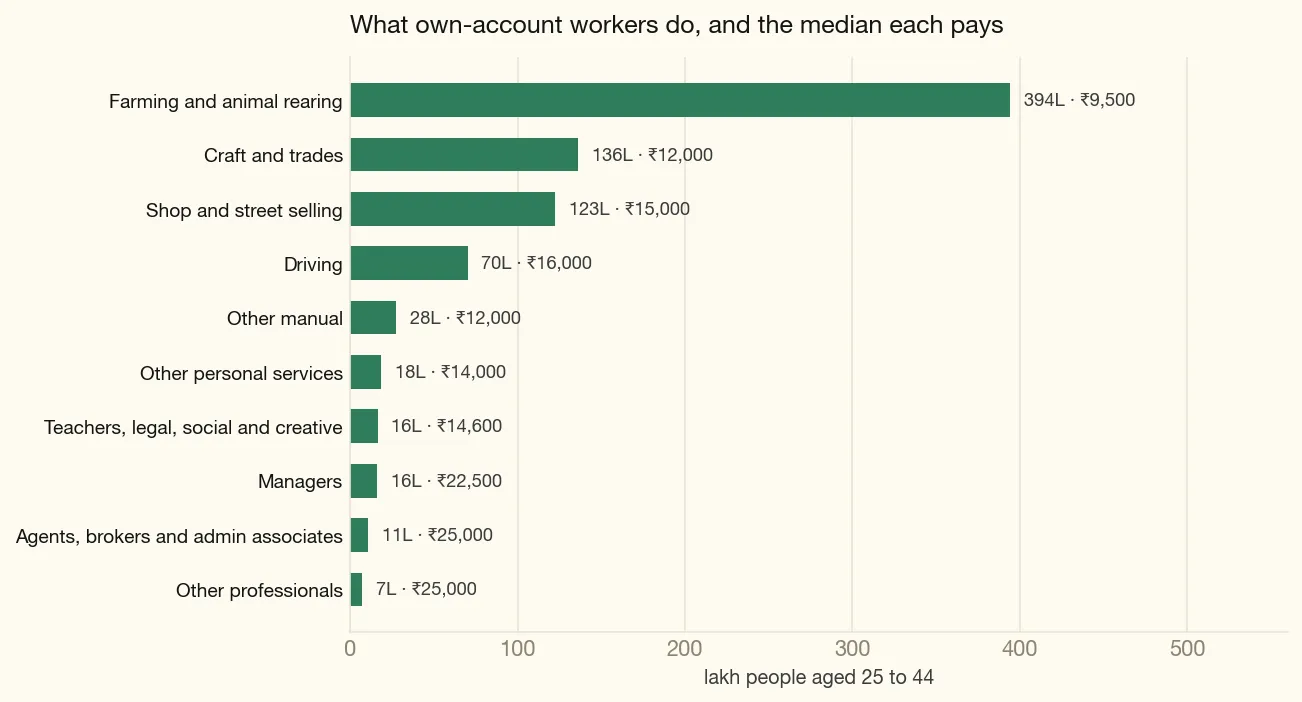
Figure 5. What own-account workers do, with the median each occupation family pays. Half of it is farming.
Those first four rows are 87.5% of all own-account work and they pay ₹9,500 to ₹16,000. Everything paying more than ₹20,000 comes to under 5% of it put together, and the most qualified corner of it, the science, health and IT technicians, is 0.3%, about 2 lakh people. The teaching row is the one to look at twice: own-account teaching is the largest professional occupation here, three quarters of the people in it are graduates, and it pays ₹9,000, which is less than farming. A private tutor is the most common thing a self-employed graduate becomes, and it is the worst-paid line in the table. [10]
The qualification ladder barely touches any of it. 1.3% of own-account farmers and 3.8% of own-account shopkeepers hold formal vocational training. The two rows where it reaches double figures are also the two smallest. [10]
Where a trade qualification does pay, it pays better here than on a payroll. Craft and trades is the one large own-account family where the question can be asked, and it has to be asked within sex and within trade, because formal training in own-account craft is 67% women and 65% garment work, which pools into a false negative. Among men in craft other than garments, 63 lakh people: [17]
| People | Share | Median a month | |
|---|---|---|---|
| Formal training | 2.9 lakh | 4.3% | ₹18,000 |
| Informal: hereditary, self-taught, learned on the job | 63.4 lakh | 93.7% | ₹16,000 |
| No training at all | 1.4 lakh | 2.1% | ₹16,000 |
₹2,000 a month, or 12.5%, against the ₹1,000 and 6.7% the same certificate is worth to a school-leaver on a payroll. [12] The certificate is worth about twice as much to someone working for themselves. That is the best case for trade training anywhere in this paper, and two things qualify it. It reaches 4.3% of the men doing the work. And what it is competing against is not nothing: 93.7% of them learned the trade informally, from family or on the job, and earn ₹16,000 doing so. The state is not filling a vacuum here, it is offering ₹2,000 a month more than a system that already trains 63 lakh people and costs it nothing.
For women, own-account craft pays a third of what it pays men, and training does not move it. Women in garment trades earn a median ₹5,500 with formal training, ₹5,000 with informal training and ₹4,000 with none; in other craft work, ₹3,500 and ₹3,000. Men in the same occupation group earn ₹16,000 to ₹18,000. Formal training reaches 19.3% of women in garment trades against 4.3% of men in other craft, so the training system is reaching women, and reaching them in the one trade where it cannot pay. [17]
This is growing, and for graduates it is growing while salaried work shrinks. Between 2018-19 and 2025 the self-employed share of general graduates aged 25 to 34 rose from 11.9% to 16.3% while their regular salaried share fell from 32.0% to 30.1%. They are the only group whose salaried share fell. Self-employed earnings over the same years rose 55.6% for people with Class 10 or 12, which is ahead of the 39% prices rose, and 33.3% for general graduates, which is behind it. [8,11]
Two cautions on all of the above. Self-employed earnings are gross takings over the last 30 days while salaried earnings are the previous calendar month, so the two are comparable in size but not identical in basis. And the self-employment share jumps in every group at once in the 2025 release, which we read as a real move but not one to date precisely.
5. The ITI question
Section titled “5. The ITI question”The Industrial Training Institute is a one- or two-year trade certificate whose entry bar is Class 8 or Class 10, though a majority of those who take it have finished Class 12. [14] It is the government’s main instrument here: PM-SETU commits ₹60,000 crore over five years to upgrade 1,000 government ITIs, of which the Centre’s share is ₹30,000 crore. [35] The system it is upgrading is 14,789 institutes, of which 3,194 are government and 11,595 private, and the government ones run fuller: 56.7% of their seats are taken against 43.1% of private ones. Running the government half costs about ₹10,000 crore a year already. [36] Against that, MERITE, the only central scheme for state engineering colleges and polytechnics, is ₹4,200 crore over five years and was budgeted at ₹300 crore in its second year. [20,21] Of ₹34,200 crore of new central money for technical education in 2025–30, 88% goes to ITIs.
What the certificate does. Compared with people of the same schooling and no training, at ages 25 to 29 it roughly doubles the chance of a regular salaried job (38% against 18%), doubles the chance of a written contract and of social security, and halves the chance of casual daily work. By ages 35 to 44 it carries about ₹8,000 a month more and a 14% chance of a government job against 5%. [13] These are real gains and they are the strongest case for the ITI.
A qualification changes the chance of being on a payroll much more than it changes the pay. Men aged 25 to 34: the share in a regular salaried job in 2025, and the median monthly pay of those in one, then and now. [12,37]
| In a regular salaried job, 2025 | Median pay 2018-19 | Median pay 2025 | Change | |
|---|---|---|---|---|
| Class 10 or 12, with full-time training | 47% | ₹12,700 | ₹16,000 | +26% |
| Class 10 or 12, no training | 31% | ₹10,000 | ₹15,000 | +50% |
| BA / BCom / BSc | 41% | ₹15,000 | ₹20,000 | +33% |
| Polytechnic diploma | 56% | ₹15,000 | ₹20,000 | +33% |
| Engineering degree | 70% | ₹28,000 | ₹40,000 | +43% |
The first column moves a long way: 31% for a school-leaver with no training, 47% with it, 70% for an engineering graduate. The pay columns barely separate the first four rows, and they move in the wrong order. The untrained school-leaver’s pay grew fastest of anyone in the table.
Consumer prices rose 39% over the same six and a half years, so read the pay columns against that rather than against each other. [11] Three of the five lines lost ground. The trained school-leaver lost the most, about 10%: ₹12,700 in 2018-19 would have to be ₹17,700 by 2025 to buy the same things, and it is ₹16,000. The general degree and the polytechnic each lost about 4%, which is inside one rounding step of medians that heap on multiples of ₹1,000, so call those two flat. Only the untrained school-leaver, at 8%, and the engineering degree, at 3%, are ahead of prices. The reward for taking the training has fallen from ₹2,700 a month to ₹1,000. A route whose pay is falling behind every other route, and behind prices, is not one a family will choose, whatever it is called. These are small samples, 134 to 671 men per survey round, and “training” here means any full-time formal course, not ITIs alone. But the direction is not ambiguous.
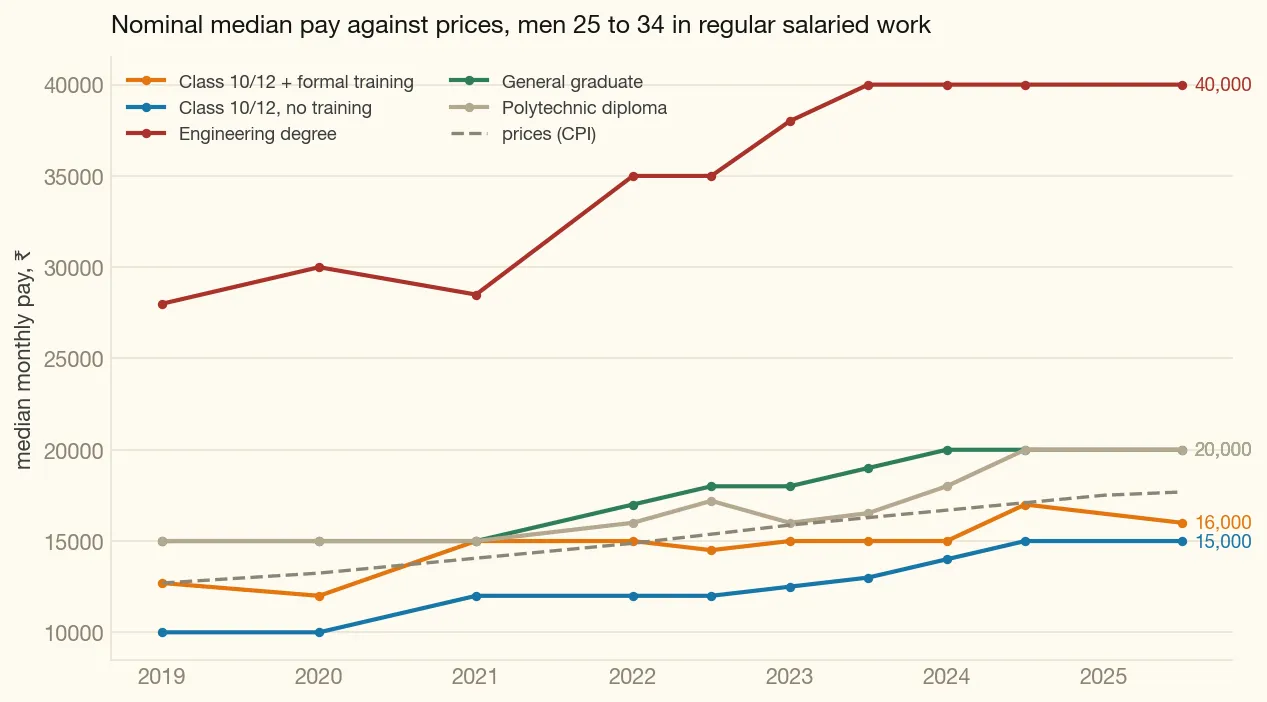
Figure 6. Nominal median pay for men aged 25 to 34 in regular salaried work, against consumer prices on the same base. A line below the dashed one has lost ground.
Two more things about ITIs that the schemes do not account for. First, the people entering are not the people the system was designed for, and this is now the system’s own finding rather than our inference. The government’s national tracer study of ITI pass-outs records what each of them held before joining: 54.3% had already completed Class 12, 35.9% had Class 10, and 7.2% already held a graduation. [14] The Industrial Training Institute is majority a post-Class-12 destination. It is not upstream of the general degree; it competes with it for the same Class 12 leaver.
Our own survey proxy points the same way and overshoots. Of everyone aged 18 to 24 in full-time formal training, 46% hold Class 12 and 34% hold a degree, with only one in seven stopped at or before Class 10. [38] That counts full-time courses of every kind, not ITIs alone, which is why its graduate share is four times the tracer’s. Where the two agree is the part that matters: the Class 10 leaver is a minority of entrants on both counts.
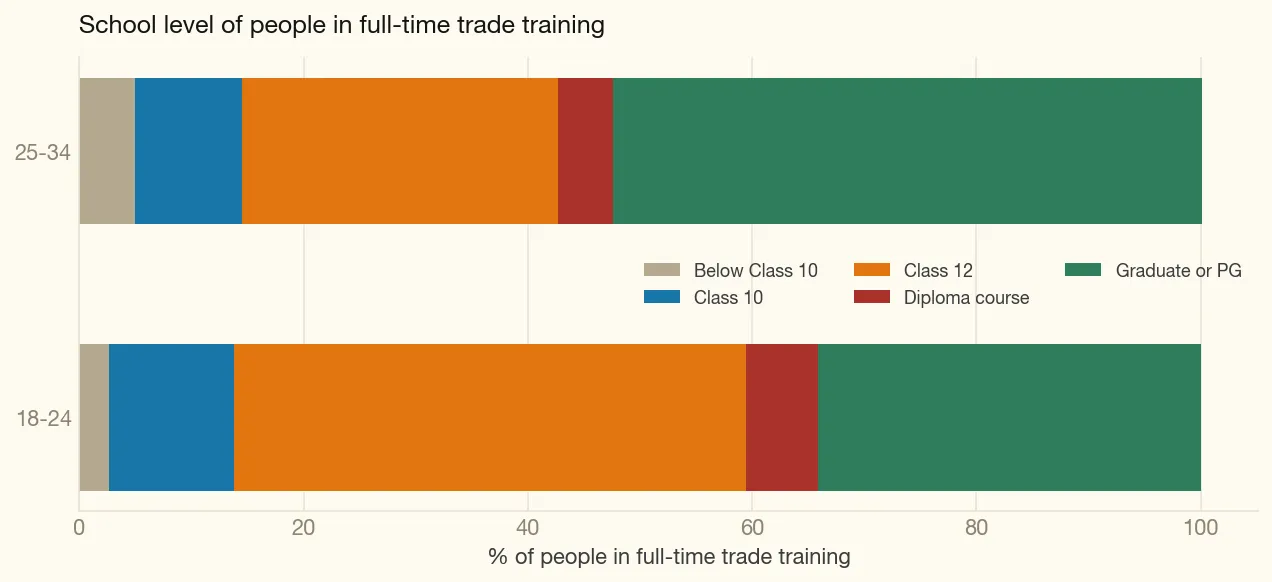
Figure 7. The school level of people in full-time trade training. Most already hold Class 12 or more.
The generous reading is that work is short enough that Class 12 passers will take a trade course, because it does keep them in work: a school-leaver with training is on a payroll 47% of the time against 31% without. [37] The harder reading is that they are crowding out the person the seat was built for. Employers sort applicants by school level, because a Class 12 pass reads an English work instruction and does the arithmetic on a quality chart, so the Class 10 leaver is being pushed out of the ITI’s best outcomes by the Class 12 passer, exactly as the diploma holder is pushed out of the junior engineer’s job by the engineering graduate. [39] Both readings fit the numbers and neither source separates them.
This is not a town phenomenon. 63% of the people aged 18 to 24 in full-time training live in rural India, and the rate of taking training is nearly flat between the two: 1.4% of rural 18 to 24 year-olds against 1.8% of urban. The rural and urban rates sit within a few tenths of a point of each other at every school level, and for people who stopped at or before Class 10 the rate is near zero in both, 0.11% rural and 0.22% urban. The graduate-heavy mix is happening in villages as much as in towns, which rules out a rural-access fix for it. [40] Where the institutes themselves sit is a different question, and it is answered by the DGT’s register rather than by a household survey, so we have not tested it.
Second, the same tracer study is blunt about what the certificate leads to. Of 11,136 pass-outs surveyed a year after finishing, 85% were economically active, and 51% of those were unemployed and available for work. The 49% who were working is the figure the scheme reports, and it missed its target: the employment indicator had already been revised down from 65% to 50% at the first restructuring, and 49% fell short of the lowered bar. [41] Among the half who did find work, 45% of the wage-employed earn between ₹5,000 and ₹10,000 a month. Four in five pursued no further qualification after the ITI. The commonest obstacle the unemployed name is that there are no jobs in their hometown (56%), and the second is that the salary offered is too low (42%). Employers are lukewarm rather than hostile: 45% rate the relevance of ITI training to the skills they actually need as merely average, and 84% want more hands-on training, but 95% intend to keep hiring. [14] And 36% of sanctioned instructor posts are filled, on a national dashboard the government’s own review says is not reliably updated. [36]
Uttar Pradesh, where the study covers the whole system rather than the funded part of it, reads far worse. Of 9,644 graduates traced one to one and a half years after qualifying, 8.7% were employed and 0.6% in an apprenticeship, against 68.4% unemployed and 22.3% not looking. A year further on it had got worse rather than better, with unemployment moving from 68.5% to 70.5% and every category of engagement shrinking. [42] Three things separate that from the national study rather than contradicting it. The national study covers STRIVE-funded institutes, 95% of them government; Uttar Pradesh covers all 3,210 of its institutes, and its unfunded ones do much worse than its funded ones. The two count differently, the national one reporting against the economically active and folding in apprenticeship, the state one reporting against everybody. And Uttar Pradesh’s own baseline is low: the average graduate there applied for 1.9 jobs and attended 0.6 interviews. Whatever is wrong in Uttar Pradesh, it is not only that nobody is hiring.
The state study also answers a question the national one cannot, because it covers both sectors. Ownership matters less than funding: privately-run STRIVE institutes place 22.4% against 7.4% at government institutes outside the scheme, and government institutes inside the scheme beat private ones outside it, 11.3% against 9.4%. The scheme looks like the thing that works, in a system where only 8% of institutes meet its own grading threshold and the average grade is 1.41 out of five. [42,36]
The apprenticeship route has become part of the same problem rather than a way out of it. The Apprentices Act channel, and the national scheme built on it, now works mostly as a way of absorbing ITI pass-outs. On the account of an industry human-resources head who hires several thousand people a year, the attraction is structural rather than educational: an apprentice is not a workman, so the position sits outside the headcount that triggers standing orders and contract-labour registration, and outside provident fund, insurance and gratuity, at a stipend below what the same person would cost on a staffing vendor’s payroll. Roughly a quarter to a third are converted to permanent rolls. [39] The Uttar Pradesh tracer followed its 55 apprentices: half were still apprentices, 3.6% had reached a regular salaried job, and 43.6% were unemployed. [42] The predecessor scheme, NEEM, was withdrawn in 2022 after the provident fund authority ruled its trainees were not exempt from counting as employees. [43] Industry reports a million apprentices in ten years and a 98% transition to formal employment, but that figure is self-reported, and the newer internship scheme has spent ₹87 crore of ₹10,831 crore. [44] None of this answers what the young people in this paper want, which is a qualification that opens doors and pay that rises over a working life. We hold no independent outcome data on the apprenticeship scheme, which is listed in section 14 as one of the things nobody publishes.
One finding from the scheme’s own completion report deserves to sit next to any argument for performance grants. STRIVE capped its grants at ₹2 crore an institute, which the Bank’s own review says left funded institutes at a financial disadvantage against unfunded ones free to raise larger private and corporate money; the scheme paid for no transport allowances or facilities for disadvantaged students; and Scheduled Tribe enrolment in STRIVE institutes came in half a percentage point below the national ITI average. The first disbursement arrived 30.5 months after the board approved it. The report’s own recommendation is for more money for civil works, not less, which is the opposite of the direction argued here and is stated so the reader can weigh it. [41]
The ITI money is justified and the certificate does work, as far as it goes. For the 1.3 crore people in each cohort who leave school at or before Class 10 it is the only formal route there is, and the poorest part of the population is in that group. That they are now a third of their own system’s intake is an argument for protecting their place in it, not for spending less on it. It roughly doubles the chance of a payroll and of a written contract, and PM-SETU is built to pay against verified results rather than against receipts: it is a World Bank Program-for-Results, a US$830 million loan approved in February 2026 alongside the Asian Development Bank, disbursing against six indicators checked by an independent verification agency. The largest of the six, US$277 million of the 830, is an employment rate: the share of graduates of the supported institutes who are in wage work or self-employment a year on, measured by an annual tracer survey and paid out from the third year. [45] That is a break with the record. Its predecessor, the Model ITI scheme, was written to spend a quarter of its money on buildings and half on equipment, and by its mid-term review had spent 58% on buildings and 31% on equipment, with eleven of the sixteen institutes that had spent anything spending nothing at all on learning materials. [46] But the indicator counts a graduate as employed at any wage, on a payroll or working alone, and recommendation 5 is written against that gap. The number left to move is pay. At ₹16,000 a month, and ₹1,000 more than no training at all, the certificate does not yet buy the wage that makes a family choose it, and that is the number PM-SETU’s outcome payments should be tied to. Run well, the scheme still leaves untouched the second group above, the graduates and diploma holders who are looking for work and not finding it.
6. The top: engineering and medicine
Section titled “6. The top: engineering and medicine”Engineering and medicine take about 3% of each cohort between them; every professional degree together takes 5%. [18] Getting into that 3% has its own price, paid before any college charges anything. Among 1,002 students surveyed in Kota, the country’s most intensive coaching town, 87% were paying a lakh or more a year in coaching fees and 72.8% between one and two lakh; 85% spent six to seven hours a day in the institute; and half were not there for the first time - 26.4% on a second attempt, 13.2% on a third, 1.6% on a fourth or later. Asked what they would do if they did not pass, 29.9% said they would clear it no matter what, and a further 20% had no plan or had not thought about one. These are students inside the funnel rather than a sample of all aspirants, so read them as the cost of trying hard at this, not as an average. [47]
There are too many engineering seats and not enough good ones. Roughly a third sit empty in both government and private colleges, and across the states that hold most of the seats only 64% of the 2018-19 intake had graduated four years later, from 36% in Kerala to 85% in Maharashtra. [19] Government colleges, which are the ones poor students can afford, have not expanded, and there is no programme of any size aimed at the ones that underperform: MERITE, the only central scheme for state engineering colleges and polytechnics, is ₹4,200 crore over five years and was budgeted at ₹300 crore in its second year. [20,21] Government owns about one engineering seat in seven. [48]
Teaching posts go unfilled, and at the institutions that do publish, the scale is large: 34% of sanctioned faculty posts across the IITs, IIITs, NITs, IIMs and central universities are vacant, 14,042 of 41,351, running from 29% at the NITs to 54% at the IIITs. [49] Those are the best-funded institutions in the country. Nobody publishes the equivalent for state engineering colleges, which is where the students in this paper would go, and that gap is part of what recommendation 7 is asking for. The one state figure we have is Karnataka’s, and it is worse than the central one: 307 of 646 sanctioned teaching posts vacant across its 16 government engineering colleges, 48%, on the state technical-education department’s own annual report, with no recruitment since 2010. [50] Meanwhile the state pays for a large share of poor students to attend private engineering colleges, through state fee-reimbursement schemes and the Post-Matric Scholarship, an estimated ₹8,000 to ₹12,000 crore a year, none of it portable to a government diploma. [32]
At ages 35 to 40, engineering graduates are in regular salaried work 75% of the time at a median ₹52,000 a month, the best outcome in the data; within men it is 80%. [15,51] They are also the most urban group: 77% of engineering graduates aged 25 to 34 live in towns. [22]
The money should go to funding the good government colleges properly, filling their teaching posts, and making the subsidy a poor student already carries work as hard in a government college as it does in a private one, rather than to more seats.
7. The general degree
Section titled “7. The general degree”The general degree is not an irrational choice. It costs about ₹5,000 a year at a government college, attendance is loose enough to earn or prepare for exams alongside, and it keeps every government exam open, from clerical posts to the civil services. [33,26] Nothing else on that list does all three. Nor is it worthless: measured across higher education as a whole, the return per year of study is highest at degree and diploma level. [52]
But the general degree on its own is now the weakest route in the data that still counts as higher education. At ages 35 to 40, general graduates are in regular salaried work 35% of the time at ₹25,000 a month, below the polytechnic diploma (59%, ₹28,000), below a general degree with training (52%, ₹28,000), and far below the post-degree diploma (74%, ₹55,000 for the engineering kind). [15] Within men the same order reads 48%, 62%, 71% and 83%: the trained graduate and the polytechnic swap places when women are added, because only 10% of polytechnic holders are women against 46% of trained graduates. [51] And the general degree is where most women are, and where participation is lowest: only 32% of general-graduate women aged 35 to 40 are in the labour force at all, against 51% of polytechnic diploma holders and 87% of women with a post-degree medical diploma. [51]
Ages 25-29. Share of the whole group in each situation, and what the regular salaried among them are paid.
| Qualification | In a regular salaried job | With a contract or social security | Self-employed | Median pay of the salaried | Sampled |
|---|---|---|---|---|---|
| Engineering PG | 63.4% | 53.1% | 7.1% | ₹35,000 | 282 |
| Engineering degree | 61.5% | 56.6% | 8.3% | ₹35,000 | 1,964 |
| Grad-level diploma, engineering | 59% | 52.9% | 7.3% | ₹35,000 | 479 |
| Polytechnic diploma | 52% | 36.9% | 15.8% | ₹18,000 | 1,483 |
| Grad-level diploma, medicine | 50.4% | 42.5% | 13.6% | ₹25,000 | 225 |
| Medicine degree | 50.4% | 41.1% | 10.5% | ₹30,000 | 507 |
| Other technical degree | 41.1% | 32.6% | 8.6% | ₹25,000 | 1,748 |
| Sub-degree diploma, other | 40.3% | 27.5% | 13.7% | ₹18,000 | 1,722 |
| Sub-degree diploma, medicine | 39.9% | 24.9% | 11.3% | ₹15,600 | 401 |
| General PG + vocational | 38.5% | 31.9% | 11.2% | ₹20,000 | 732 |
| Class 10 + vocational | 33.3% | 18.8% | 21.8% | ₹15,000 | 412 |
| General graduate + vocational | 33.1% | 21.5% | 16% | ₹18,000 | 2,075 |
| Grad-level diploma, other | 32.7% | 24.3% | 11.7% | ₹21,000 | 842 |
| General PG | 31.9% | 24.3% | 11.8% | ₹25,000 | 4,504 |
| Class 12 + vocational | 29.2% | 17.7% | 19.5% | ₹15,000 | 1,168 |
| General graduate | 25.1% | 16.6% | 14.3% | ₹18,000 | 17,826 |
| Class 12, stopped | 19% | 8.1% | 18.7% | ₹15,000 | 17,666 |
| Class 10, stopped | 17.6% | 5.6% | 18% | ₹14,000 | 15,307 |
Ages 30-34. Share of the whole group in each situation, and what the regular salaried among them are paid.
| Qualification | In a regular salaried job | With a contract or social security | Self-employed | Median pay of the salaried | Sampled |
|---|---|---|---|---|---|
| Engineering degree | 67.7% | 64.2% | 13% | ₹45,000 | 1,564 |
| Engineering PG | 63.8% | 60.9% | 9.8% | ₹50,000 | 360 |
| Grad-level diploma, engineering | 60.9% | 52.4% | 17.3% | ₹40,000 | 411 |
| Medicine degree | 60.8% | 49% | 20.4% | ₹39,000 | 292 |
| Grad-level diploma, medicine | 59.2% | 46.1% | 23.3% | ₹35,000 ~ | 147 |
| Polytechnic diploma | 54.8% | 42.2% | 22.2% | ₹22,000 | 1,116 |
| General PG + vocational | 50% | 38.9% | 13% | ₹26,000 | 549 |
| Other technical degree | 49.4% | 40% | 13.3% | ₹30,000 | 1,446 |
| Grad-level diploma, other | 47.3% | 38.7% | 14.2% | ₹32,000 | 630 |
| Sub-degree diploma, medicine | 47.2% | 35.8% | 19.8% | ₹18,000 | 293 |
| General graduate + vocational | 44.4% | 34.6% | 19.1% | ₹24,000 | 1,403 |
| Sub-degree diploma, other | 43% | 30.5% | 25% | ₹19,200 | 1,237 |
| General PG | 37.8% | 29.9% | 15.3% | ₹30,000 | 3,942 |
| General graduate | 30.7% | 21.8% | 21.3% | ₹20,000 | 12,243 |
| Class 12 + vocational | 27.4% | 19.6% | 28.2% | ₹18,000 | 878 |
| Class 10 + vocational | 25.9% | 10.7% | 37.8% | ₹17,500 | 445 |
| Class 12, stopped | 21.4% | 11% | 25.6% | ₹15,000 | 13,006 |
| Class 10, stopped | 17.2% | 6.5% | 26.5% | ₹15,000 | 13,508 |
Ages 35-44. Share of the whole group in each situation, and what the regular salaried among them are paid.
| Qualification | In a regular salaried job | With a contract or social security | Self-employed | Median pay of the salaried | Sampled |
|---|---|---|---|---|---|
| Engineering degree | 75.8% | 73% | 13.2% | ₹55,000 | 991 |
| Grad-level diploma, engineering | 74.8% | 68.9% | 13.8% | ₹55,000 | 353 |
| Engineering PG | 71.5% | 69.3% | 12.2% | ₹65,000 | 367 |
| Grad-level diploma, medicine | 60.8% | 55.7% | 32.9% | ₹45,000 | 209 |
| Grad-level diploma, other | 59% | 51.2% | 17% | ₹40,000 | 960 |
| Other technical degree | 58.9% | 52.2% | 15.6% | ₹41,000 | 2,164 |
| Polytechnic diploma | 58% | 48.7% | 25.9% | ₹28,000 | 1,068 |
| General PG + vocational | 57.5% | 51% | 17.9% | ₹40,000 | 824 |
| Medicine degree | 54.4% | 51.4% | 31.5% | ₹45,000 | 355 |
| Sub-degree diploma, other | 51.9% | 42.4% | 24% | ₹28,000 | 1,633 |
| General graduate + vocational | 51.3% | 40.5% | 20% | ₹30,000 | 1,805 |
| Sub-degree diploma, medicine | 48% | 39.6% | 19.4% | ₹25,000 | 358 |
| General PG | 46% | 38.2% | 20.1% | ₹36,000 | 5,413 |
| Class 12 + vocational | 41.4% | 31.2% | 31.3% | ₹22,500 | 1,221 |
| General graduate | 35.2% | 26.6% | 27.1% | ₹28,000 | 14,659 |
| Class 10 + vocational | 30.4% | 14.2% | 35.8% | ₹18,000 | 752 |
| Class 12, stopped | 22.7% | 12.7% | 36.1% | ₹16,000 | 18,075 |
| Class 10, stopped | 19.3% | 8.6% | 34.5% | ₹15,000 | 24,202 |
A ~ marks a median resting on fewer than 100 sampled earners.
8. What actually works
Section titled “8. What actually works”Two routes beat everything else available to a student who is not going to an elite college, and between them they reach about 8 lakh people in a cohort of 2.5 crore. Both sit above the trade certificate and below the professional degree.
A note on how to read every figure in this section. These are people aged 35 to 40 today, which is a snapshot rather than a promise to a 25-year-old. We tested the snapshot against the first release, seven years earlier: the shape holds, and each route’s regular-salaried share rises with age by about the same amount in 2018-19 as in 2025. The one drift is the general degree’s, whose whole profile has fallen 3 to 5 points over the seven years, so 35% at 35 to 40 is an upper bound for someone who is 25 now. The polytechnic’s has moved the other way, from 49% to 59% at the same ages, though that particular cell rests on 45 sampled women and should be read as a direction rather than a magnitude. Decomposing both drifts shows they are not a change in who holds the qualification: the sex mix of each route moved, but it accounts for at most 2 points of any of these shifts. The general degree’s slip is a real within-sex fall, and it is concentrated in mid-career, 3.8 points at 30 to 34 and 2.9 at 35 to 40, against nothing at all at 25 to 29. [53,54] Figures below are for everyone unless a sentence says men or women; where a ranking between routes is claimed we use the within-sex table, because pooling re-orders two routes whose sex mix differs sharply, and the paper would rather give a true order than a flattering one.
A general degree plus a real trade qualification. People aged 35 to 40: 52% in a regular salaried job against 35% without, and 22% in a government job against 13%, at ₹28,000 against ₹25,000. Within men it is 71% against 48%; within women 30% against 18%. [15,51] The advantage holds inside every fifth of household spending, which rules out the easy objection that this is just richer families doing both. In the poorest fifth it is 67% against 30%, and in the richest 72% against 58%. [16] The same holds one rung down: Class 12 plus training beats Class 12 alone in every spending band. What this does not buy is a raise. It buys a payroll.
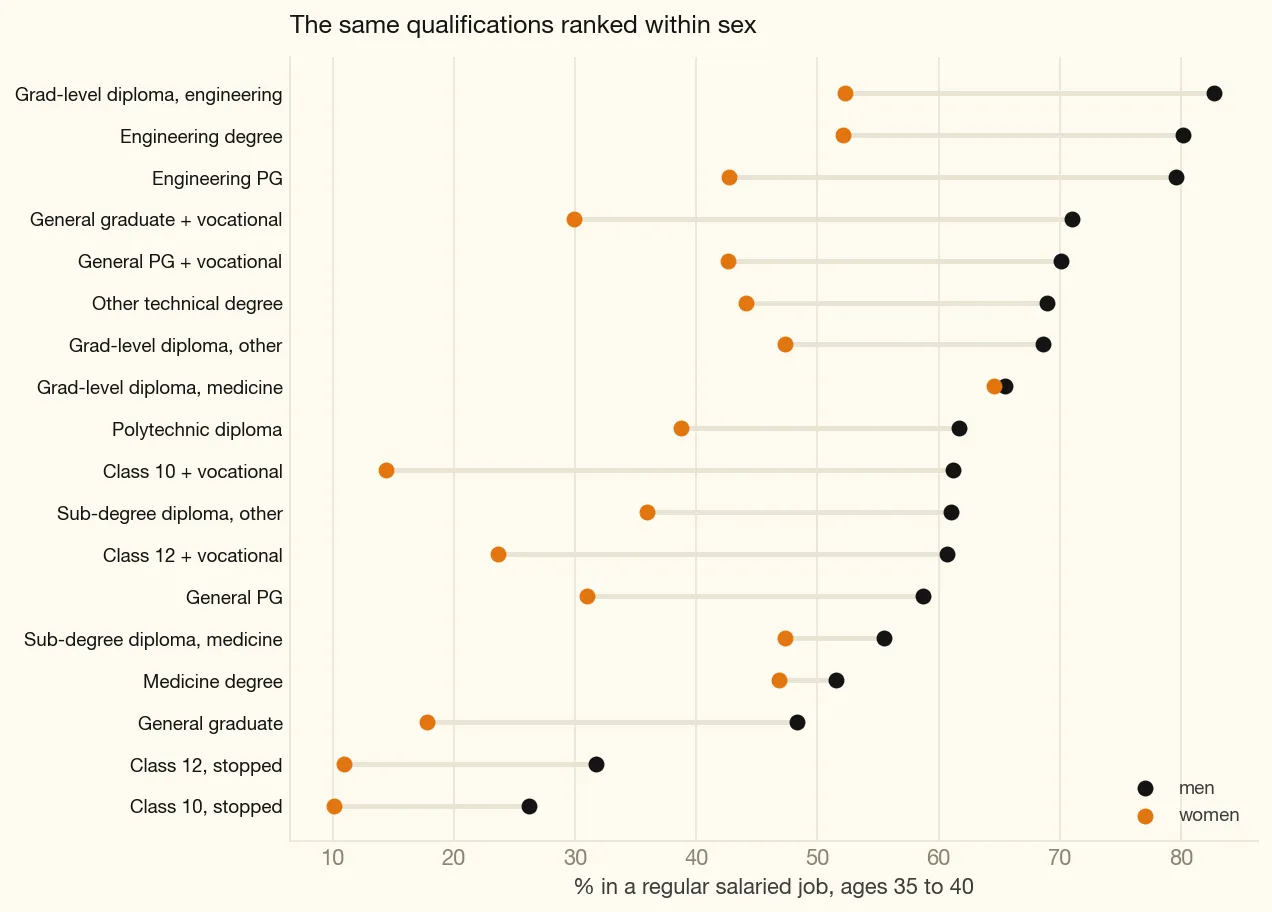
Figure 8. The same qualifications ranked within sex, on the share in a regular salaried job at 35 to 40. Pooling the two re-orders the list, which is why the paper ranks within sex.
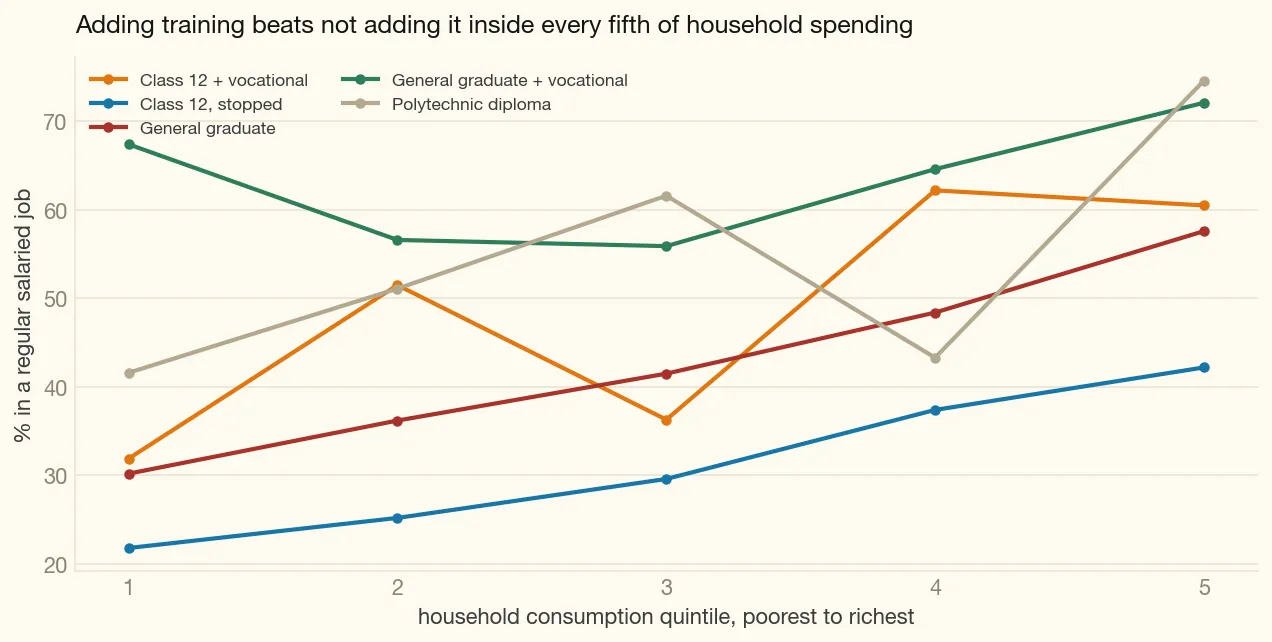
Figure 9. Adding training beats not adding it inside every fifth of household spending, men aged 30 to 44.
A post-degree diploma. The strongest single outcome in the data: 74% in regular salaried work at ₹55,000 for the engineering kind, and for women the medical version leads every route, with 87% in the labour force and 65% in a regular salaried job. [15,51] This is also the most selected group in the data, being small, urban and reached by people who already did well, so a scaled-up version will not reproduce those numbers. The promise a BA student should be given is the trained graduate’s 52% payroll rate at ₹28,000.
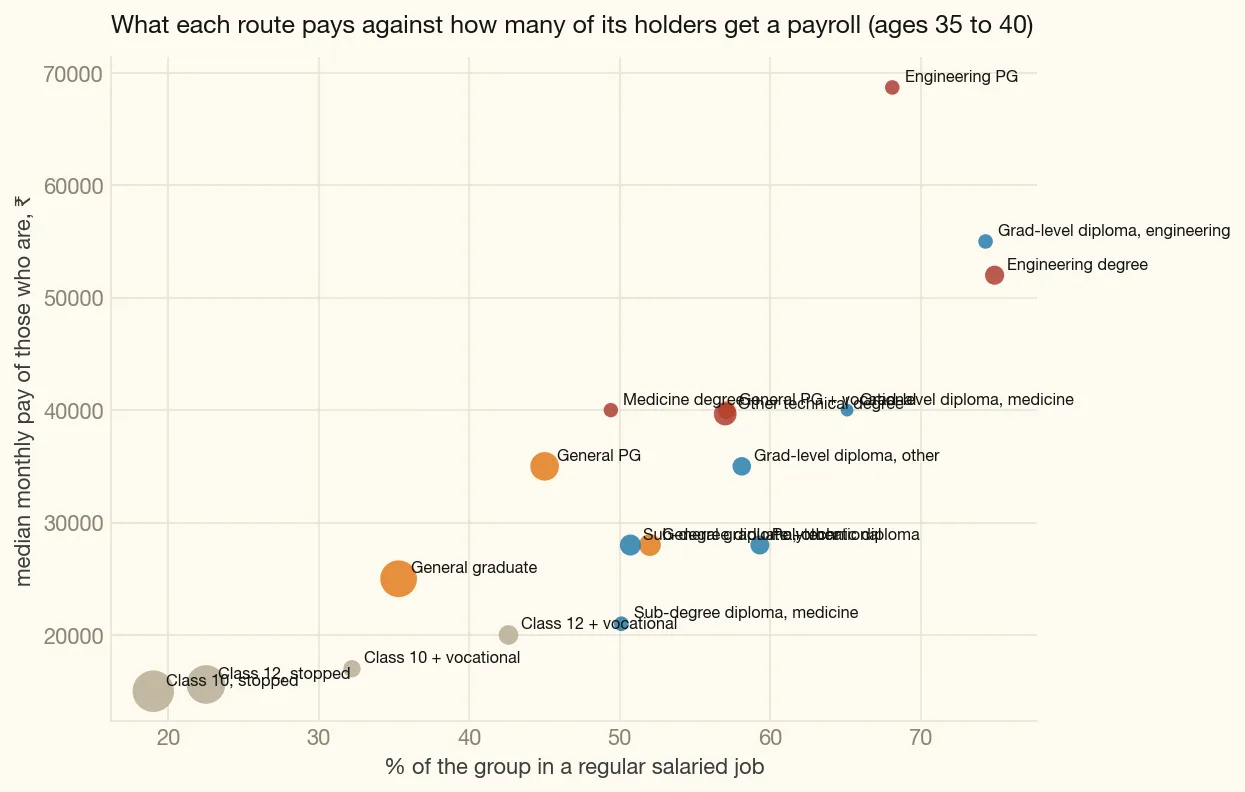
Figure 10. Every qualification placed by what it pays against how many of its holders reach a payroll, ages 35 to 40. Dot size is sample size.
Both are small, and neither has a scheme. Only one of them is urban. About 4.6 lakh general graduates with training and 3.3 lakh post-degree diplomas a year, against 43 lakh general graduates. [18] Of holders aged 25 to 34, 56% of post-degree diploma holders and 52% of trained graduates live in towns, against 46% of plain general graduates and 33% of people who stopped at Class 12. The polytechnic diploma is the exception and it is the useful one: 44% of its holders live in towns, marginally less urban than the general degree, so the route the paper wants to grow is already a village route as much as a town one. All of this measures where holders live rather than where the colleges are. [22] Two research passes found no central programme for post-degree diplomas beyond the open university and two central institutes, and the B.Voc degree that was meant to do this has stalled: in the one field study we could find, half the colleges had received only half their grant, some had closed programmes for want of funds, and only three in ten were filling their seats. [23,55] How many young people know these routes exist is not measured anywhere, including here.
9. Why they wait for a government job
Section titled “9. Why they wait for a government job”A young person from a family without money, who is not going to an elite college, and who wants to earn ₹25,000 to ₹30,000 a month rather than drive a delivery scooter, is not choosing between a government job and a good private one. The survey says what those two numbers are worth: ₹25,000 to ₹30,000 a month is roughly what a general graduate or a polytechnic diploma holder earns in a regular job in his late thirties, and ₹15,000 is what a school-leaver earns. [51,12] Waiting for a government job is a rational bet on the better of those two.
What a government job is actually worth. A median ₹30,000 a month against ₹15,000 in private salaried work, a gap of two to one that has not narrowed in seven years. Government provides 55% of all jobs paying ₹50,000 or more, down only a little from 61% in 2018-19, so its share of the good jobs has held even as its share of salaried work overall fell from 30% to 24%. And it is a bigger part of the salaried labour market in rural India, 29%, than in towns, 21%. [25] For someone outside a city who is not willing to take ₹15,000 with no growth, and who has no polytechnic within reach or has never heard of one, there is no other option at this scale. That is the whole explanation of the queue, and none of it is a mistake.
One thing has changed under them. Government’s share of the jobs paying ₹25,000 or more has fallen hard, from 61% in 2018-19 to 44% now, because private salaried work has grown in that middle band. The very top is still government; the rung below it is no longer. [25]
The rules make it rational. Class 10 or an ITI certificate opens the lowest two pay levels, where the queue is 200 to 330 applicants a vacancy. A polytechnic diploma opens the junior engineer’s post at ₹35,400. A degree opens everything from clerical work to the civil services, and the queue there is shorter per post but the posts are fewer: in 2024-25 the Railways advertised about 10,000 graduate and 8,000 junior engineer posts against 32,000 Group D and 19,000 technician posts, and the Staff Selection Commission 18,000 graduate posts against 47,000 constable posts. [26] The scale of the queue is easier to see from the other side: in 2013 more than one in four recent college graduates in Tamil Nadu sat one of these exams, and over 100,000 people in that state alone were unemployed and studying full time for them. [56] More than half of young people say they want a government job. [24] General graduates hold 23% of all government jobs, though only one in ten general graduates has one. [27] For Scheduled Caste, Scheduled Tribe and Other Backward Class families there is a further reason: a reserved post is a claim the law gives them, and it is the one part of the labour market that owes them one. The erosion of the degree itself has also fallen on them hardest. In the districts where colleges expanded most, the graduate wage premium eroded by about 9% for non-SC/ST graduates after 2004 and by a further 34% for SC and ST graduates, though the absolute return to a degree stayed large throughout. That is a district-level comparison rather than a public-against-private one, it is a preprint, and its author flags the limits of the design rather than claiming clean identification, so read it as the direction of travel. [57]
The wait ends by 30. What it ends in is mostly not a regular job. Following the same men born between 1994 and 1997 across six survey rounds, unemployment falls away: general graduates go from 43% unemployed at 23 to 8.5% at 29, engineers from 57% to 7%, polytechnic diploma holders from 35% to 7%, those who stopped at Class 12 from 23% to 3%. The regular-salaried share over the same years tells the part that matters. General graduates go from 19% to 44%, so at 29 the majority of them are still not on a payroll; those who stopped at Class 12 reach 35%; polytechnic diploma holders 54%; only the engineers get to 73%. [58] They are not unemployed at 29. They are doing whatever work was available, which is the self-employment, daily wage and family work of section 1. Men born four years later sit on the same curve at the same ages. The wait tracks the years in which government exams are open to them. For the Staff Selection Commission, the largest graduate recruiter in the country, the door shuts at 27, 30 or 32 depending on the post, three years later for Other Backward Classes candidates and five for Scheduled Caste and Scheduled Tribe candidates. [59] The one piece of causal evidence points the same way. When Tamil Nadu froze public hiring between 2001 and 2006 and cut 86% of vacancies in the affected sectors, the male graduates exposed to it spent less time employed, by about 9 percentage points, and a decade later appear to have lower earning capacity and formed households later. Preparation time is the mechanism the author infers rather than the thing measured. [60] Fewer posts lengthen the wait; a training scheme does not shorten it.
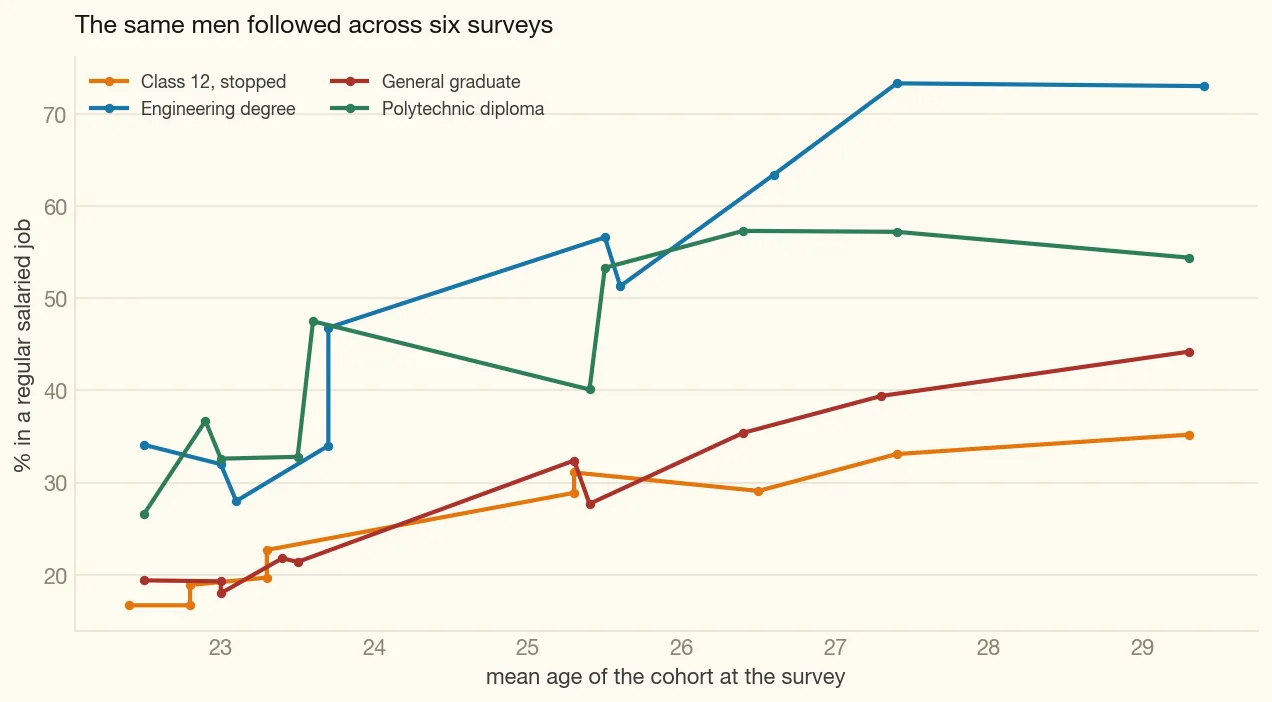
Figure 11. The same men followed across six surveys, so the line is one cohort ageing rather than a snapshot across ages.
This also disposes of the popular claim that graduates are “unemployable”. By their late twenties almost all of them are working. The question is what they are working at: of employed general graduates aged 25 to 34, a fifth are in farming and a fifth in sales, though the same test applied to polytechnic diploma holders puts 62% of them in manual and service work, so it describes the labour market rather than either qualification. [61]
The official diagnosis says something else. It holds that degrees are “pursued for prestige or government exam eligibility” and that vocational routes “continue to face low trust and social stigma”, and it proposes to change perceptions. Read NITI’s sentence in full and the disagreement is narrower than it looks: that sentence opens “As a result”, and what it follows from is a lack of trusted guidance, so NITI treats prestige-seeking as a counselling failure that better information would correct. [62] This paper says the pursuit is correctly informed. Pay levels, vacancy counts and reservation rules are not perceptions. They are prices, and the government proposing the campaign is the one that sets them.
10. The employer that stopped hiring
Section titled “10. The employer that stopped hiring”Between 2018-19 and 2025, for people aged 25 to 54: [28]
| 2018-19 | 2025 | Change | |
|---|---|---|---|
| Government salaried jobs | 2.06 crore | 2.27 crore | +10% |
| All regular salaried jobs | 6.93 crore | 9.38 crore | +35% |
| Government’s share of regular salaried work | 30% | 24% | −6 points |
| Share of government staff aged 25 to 34 | 33% | 30% | −3 points |
Government did not shrink. It stood still while private salaried work grew, and it got older. For the group this paper is about, educated but not elite and aiming at a government job, the employer they are aiming at has been taking a falling share of a growing market for six years. Private salaried work now employs more general graduates than government does; what government offers is the pay scale, the tenure and, for reserved categories, a hiring process that cannot discount them.
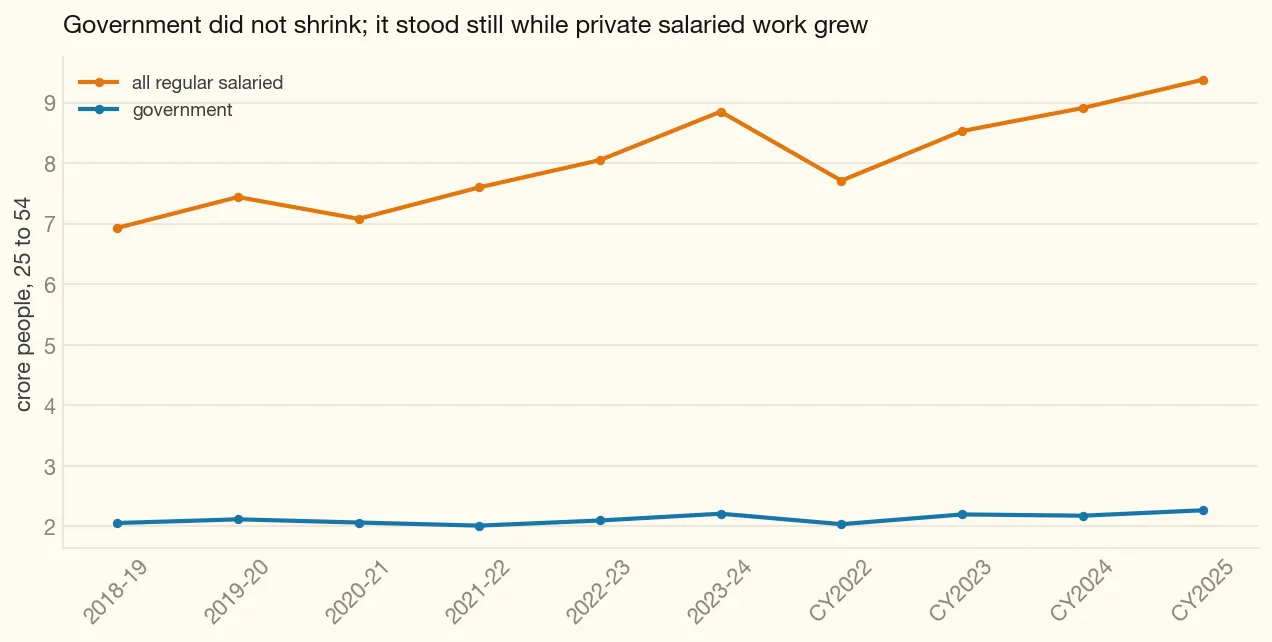
Figure 12. Government salaried work did not shrink. It stood still while private salaried work grew around it.
The survey cannot see the outsourcing, and this matters. Inside government, short fixed-term contracts of three years or less are flat at 10 to 11% across the whole period, and contracts of more than three years actually rose from 53% to 67%. [28] That is not evidence against contractualisation; it is a measurement limit. A person who cleans, guards or staffs a government office on an agency’s books is recorded by the survey as an employee of that private agency. What the survey shows is the shrinking share. The contract staffing has to be established from administrative records, which we have not read.
Where it is visible is in the teaching posts. A third of sanctioned faculty posts stand vacant across the central technical and higher-education institutions, 14,042 of 41,351, on the parliamentary committee’s own figures. [49] For state engineering colleges there is no published national count. The one state we can see is Karnataka, where 307 of 646 sanctioned teaching posts are vacant across the 16 government engineering colleges and 1,023 of 1,150 non-teaching posts, with no recruitment since 2010. What that costs is not hypothetical: the regulator inspected three of those colleges and ordered their intake cut by a quarter, naming faculty shortage among the reasons. [50] Officials with direct experience describe state technical-education budgets almost entirely committed to salaries and pensions, recruitment that runs through state commissions on three-to-five-year cycles and stalls in reservation-roster litigation, and guest lecturers filling the gap. The proportions they put on that are their recollection and we could not source them, so they are not repeated here. [32] The budget figures we can check say the same thing more precisely. States carry 73% of all public spending on education and the Centre 27%. But technical education takes 14.0% of the Centre’s education-department budget and 2.6% of the states’, a five-fold difference in priority. Government engineering colleges and polytechnics are state institutions on state budgets, so the level of government that treats technical education as a small line is the level that owns the colleges. [63] These are the institutions that would have to deliver any new qualification, so filling their posts is the binding constraint on every recommendation below.
11. Why the obvious fixes have not worked
Section titled “11. Why the obvious fixes have not worked”Money for this part of the system has existed before and come back unspent. Of 500 polytechnics to be upgraded under the polytechnic scheme the skills ministry inherited in 2017, 105 have been; of 295 new ones, 159; of 499 women’s hostels, 351, with the scheme due to close in March 2026. [64] STRIVE is the sharper case, and not in the way we first read it: it spent 99% of the budget it was cut down to and 30% of the budget it was appraised against, because a third of the money was cancelled across four restructurings. The part that did not arrive was the government’s own: of the US$193 million the Centre pledged as counterpart funding it contributed US$3.84 million, 1.99% of its commitment, while the Bank’s share held. [41] PMKVY 4.0 used about 14% of its budget. [65] PM-SETU has approved about 2% of its outlay in its first year. [35]
The common thread is that money arrived without the power to hire. A state could not create posts, or could not fill them, so a grant for equipment and buildings was spent on equipment and buildings.
12. The polytechnic seats are in the wrong places, and nobody is fixing that
Section titled “12. The polytechnic seats are in the wrong places, and nobody is fixing that”The route with the best evidence behind it is also the one running with a third to a half of its seats empty, and that is the single biggest thing standing between the recommendations below and any of them working.
The money behind this is worth stating before the seats are. Technical education is 2.6% of what state education departments spend and 14.0% of what the Centre spends, and polytechnics sit on the state side of that. [63]
The system is mostly private and it is shrinking. There are about 3,566 polytechnics, 59% of them private, and government holds only about 35% of approved diploma intake. Seats run 33 to 48% empty and enrolment is falling. [29,30] No central scheme is aimed at this. MERITE, the only central money that touches polytechnics at all, is ₹4,200 crore over five years across the whole of state technical education and covers 100 polytechnic places, and it was budgeted at ₹300 crore in its second year. [20,21] Against PM-SETU’s ₹60,000 crore for ITIs, the polytechnic is not being under-funded so much as not addressed.
The empty seats and the students are in different states. Diploma seats are 35% full in Tamil Nadu, 34% in Punjab and 33% in Rajasthan, but 71% full in Bihar, 76% in Odisha and 77% in Kerala. [31] A quarter of all empty diploma seats in India are in Tamil Nadu alone. “Fill the seats you have” is right in Chennai and wrong in Patna, and a national scheme written either way will be wrong in half the country. Within a state the empty seats cluster in particular trades, namely civil, mechanical, textile and printing, and in second-shift and new-district institutions, while computer and electronics seats in cities close with cut-offs. [66]
| Route | Government | Private | What is being counted | Confidence |
|---|---|---|---|---|
| Engineering PG | 0.3 | 1.0 | seats per year | measured |
| Engineering degree | 1.8 | 11.1 | seats per year | measured |
| Medicine degree | 0.8 | 2.8 | graduates per year | estimate |
| Other technical degree | 1.8 | 10.8 | graduates per year | estimate |
| Grad-level diploma, engineering | 0.2 | 0.3 | graduates per year | estimate |
| Grad-level diploma, medicine | 0.1 | 0.1 | graduates per year | estimate |
| Grad-level diploma, other | 0.2 | 0.5 | graduates per year | estimate |
| Polytechnic diploma | 3.4 | 6.3 | seats per year | measured |
| Sub-degree diploma, medicine | 0.3 | 2.0 | graduates per year | estimate |
| Sub-degree diploma, other | 1.2 | 2.5 | graduates per year | estimate |
| General PG + vocational | — | — | — | not loaded |
| General PG | 5.6 | 8.3 | graduates per year | estimate |
| General graduate + vocational | — | — | — | not loaded |
| General graduate | 22.2 | 33.1 | graduates per year | estimate |
| Class 12 + vocational | — | — | — | not loaded |
| Class 12, stopped | 82.4 | 55.4 | enrolment per class-year | measured |
| Class 10 + vocational | — | — | — | not loaded |
| Class 10, stopped | 119.4 | 65.7 | enrolment per class-year | measured |
Lakh per year. The basis for every row is in the source CSV.
The price the student faces is not what the fee list says. A government polytechnic at ₹8,000 a year competes against a private engineering degree that costs an eligible poor student nothing, because the state reimburses the fee. [32,33] The diploma is more expensive in practice than the degree it is supposed to be an affordable alternative to.
| Route | Government, typical | Private, typical | Unit |
|---|---|---|---|
| Engineering degree | ₹45,000 | ₹120,000 | per year |
| Engineering PG | ₹70,000 | — | per year |
| Polytechnic diploma | ₹8,000 | — | per year |
| Grad-level diploma, engineering | ₹70,000 | — | per course |
| Grad-level diploma, medicine | — | — | per year |
| Grad-level diploma, other | ₹10,000 | ₹750,000 | per year |
| General graduate | ₹5,000 | ₹100,000 | per year |
| General graduate + vocational | — | — | per year |
| General PG | ₹8,000 | ₹105,000 | per year |
| General PG + vocational | — | — | per year |
| Other technical degree | ₹15,000 | ₹60,000 | per year |
| Class 12 + vocational | ₹3,000 | ₹19,315 | per year |
| Class 10 + vocational | ₹3,000 | ₹19,315 | per year |
| Class 12, stopped | — | — | per year |
| Class 10, stopped | — | — | per year |
| Medicine degree | ₹40,000 | ₹100,000 | per year |
| Sub-degree diploma, medicine | ₹12,000 | ₹66,000 | per year |
Hand-collected; the basis and sources for every row are in the source CSV.
The scheme history is a list of buildings. Of 500 polytechnics to be upgraded under the polytechnic scheme, 105 have been; of 295 new ones, 159; of 499 women’s hostels, 351. [64] The Model ITI scheme before PM-SETU inverted its own rulebook: told to put 25% into civil works and 50% into equipment, it put 58% into civil works and 31% into equipment. [46] A polytechnic with no teachers, in a state whose seats are already half empty, in trades the local labour market stopped hiring for, is not short of a building. Recommendations 1, 2 and 6 are written against these three facts in that order: let the colleges hire, remove the price inversion, and add capacity only where the seats already fill.
13. What to do
Section titled “13. What to do”Eight recommendations, in the order the people who would have to implement them ranked them. The
detail, meaning the instrument, who signs, the cost, who gains and what each had to survive, is in
RECOMMENDATIONS.md. The total is roughly ₹13,000 to ₹14,000 crore over five
years, about ₹1,500 crore in the first year, and no money moves out of ITI budgets. Two of the three
unit costs were estimates and have been recomputed from published pay and construction rates: the
teaching post is about ₹13 lakh a year rather than ₹12 lakh, and a 200-bed women’s hostel about ₹6
crore rather than ₹15 crore. They move the total in opposite directions and very nearly
cancel. [34]
1. Let the colleges hire. The Centre pays the full salary of newly recruited permanent teachers in government polytechnics and engineering colleges for five years, then hands the cost back to the state in steps. Money is released against appointment letters, not sanction orders, and against things the state must do: create the posts, adopt the pay scales, recruit through selection committees outside the commission cycle, sign an undertaking to absorb the cost in year six. Add a route for working engineers to teach part-time. About ₹1,200 crore in year one, ₹9,000 to ₹10,000 crore over five. Everything else on this list fails without it.
2. Let the scholarship follow the student. State fee-reimbursement schemes and the Post-Matric Scholarship should pay for a government diploma on the same terms as a private degree, with a ₹10,000 bonus on completion, hostel and living allowances at parity, and lateral-entry seats in government engineering colleges reserved for diploma holders. This is a reallocation, about ₹120 to ₹150 crore a year for the bonus. It removes the price gap described above.
3. Put a trade inside every BA, BCom and BSc. Every student takes a 300 to 600 hour practical trade module, taught by the district’s ITI or polytechnic in its unused capacity, examined by an outside body whose certificate an employer will test, credited towards the degree through the National Credit Framework, and recognised by state commissions for state posts. Compulsory across a college, not optional, because an optional trade module becomes the one the poorer students take. Funded through the existing higher-education scheme; about ₹150 crore in year one, ₹700 crore a year at 10 lakh students. This is the recommendation with the best evidence behind it and it reaches the group with the fewest options: it is where women and the poorest students already are. The poorest half of households make up 37% of general graduates against 7% of engineering graduates. [51,16,67]
4. Make the diploma count in government recruitment. Two parts. First, recognise the three-year diploma as meeting the qualification bar wherever a post specifies a degree but the work is technical, so that a diploma holder applies on the same footing as a graduate. This is the most direct way to move students towards the route, because the rules are what set the price, and it is also the hardest: recruitment rules are cadre by cadre, written by the Railway Board, by each public sector undertaking’s board, by state commissions and by departments, and a settled legal position makes it difficult to bar a higher qualification from a post a lower one opens. Second, and available immediately, reserve a fifth of junior engineer recruitment for diploma apprentices, on the model the Railways already uses for apprentices who have completed their course, extended to public sector undertakings, power distribution companies, and state public works and urban bodies. The apprenticeship is the diploma’s final year. Industry partners sign a floor of 50% conversion to permanent rolls. Costs nothing. It makes the junior engineer’s post real for a diploma holder instead of a post that engineering graduates take.
5. Run PM-SETU as it was designed, and take nothing from it. The scheme’s largest payment is already tied to an employment rate, but one that counts any wage and self-employment alike; add a pay floor to it, and verify it institution by institution rather than at the cluster level; withhold release from any hub whose spoke institutes stay under 60% full for two years; let a state move up to a fifth of its own share into polytechnic second shifts and shared trade labs in ITIs that have been merged or repurposed; close nothing. Make the open-schooling route that lets an ITI graduate finish Class 12 recognised by every state board and commission, so the certificate is not a dead end.
6. Build only where the seats are full. Second shifts, new trades replacing dead ones inside the same institution, and hostels, women’s first, in states running at 70% or better. No new campuses this cycle. Publish vacancy by trade, shift and district before adding a seat anywhere. About ₹1,500 crore of capital over five years.
7. Count payroll records, not placement claims. Link provident fund and insurance records to the student identifier for every graduate of a technical institution, published institution by institution and broken out by sex and social group from the first release. Placement counts are inflated, as industry says itself, and every scheme currently rewards them. [39] About ₹50 crore.
8. Fix the exam calendar. Publish a binding annual schedule and the number of vacancies for the national and state recruitment commissions, with a fixed rule for re-examination after a paper leak. This is the only item that shortens the wait itself rather than moving students around. It is also the only one no official at our table could deliver alone.
What we are not recommending. A new mission of PM-SETU’s size for diplomas: the evidence does not support it and the delivery record says it would come back unspent. A default diploma offer to Class 12 passers: with 10% women in polytechnics, and the poorest half of households making up 37% of general graduates against 22% of polytechnic diploma holders, that is streaming and will be read as streaming. [67] Holding junior engineer recruitment steady: nobody has that power. Loans for polytechnic students: the fees are not what binds. Closing ITIs: it does not happen, and it should not.
14. What we do not know
Section titled “14. What we do not know”- How much public money actually reaches private professional colleges through state fee reimbursement and the Post-Matric Scholarship. Nobody has added it up, and a pass through the scheme’s own documents in September 2026 showed why it is harder than it looks rather than answering it. The Post-Matric Scholarship covers all post-matriculation education, so its total cannot stand in for the part that reaches professional colleges; it is centrally sponsored on a 60:40 split, and the Centre releases its share only against the state’s share and beneficiary data verified on the National Scholarship Portal, so central releases, state releases and actual college receipts are three different numbers in any given year. Two national figures for 2023-24 circulate that measure different things. What would settle it: course-type splits from the National Scholarship Portal, and the fee-reimbursement lines in the finance accounts of Telangana, Andhra Pradesh, Tamil Nadu and Maharashtra. It decides how much of recommendation 2 is free. [68]
- How much of the gain from adding training to a degree is the training and how much is the kind of person who takes it. Holding household spending constant narrows it; it does not settle it. [16]
- Whether young people know these routes exist. Not measured anywhere, including here.
- Why a self-employed graduate earns two thirds of what a salaried one earns while a self-employed Class 10 leaver earns the same as a salaried one. Selection, sector and hours were the candidates. Hours can be ruled out as a thing this survey can test, for a reason in the instrument rather than in the sample: days and hours are summed only from cells whose paired earnings cell is positive, and earnings are recorded only for casual activity, so hours exist for casual workers and not for the self-employed or the regular salaried, who are the two groups being compared. Sector has now been tested, and it is the answer. Pooled, the self-employed graduate earns 0.72 of the salaried one. Within industry division the penalty disappears: the median of 22 within-division ratios is 1.00, and in eleven of them the self-employed graduate earns at least as much. The two groups are not doing the same work for different money. Salaried graduates are in education and financial services; self-employed graduates are in retail trade and in crop and animal production, which has almost no salaried graduates in it at all. The Class 10 leaver shows no pooled gap for the same reason in reverse: both versions of him are already in the same low-paying industries. Selection within an industry is still not separable. [8,69]
- Whether the informal training that 93.7% of own-account craftsmen hold could be certified rather than replaced. Nothing measures what recognition of prior learning is worth in this market. [17]
- Why Uttar Pradesh’s ITI graduates do so much worse than the funded institutes the national study covers. Scheme funding, counting and a low baseline each explain part of it, and nothing separates them. A two-decade anchor exists and is not much use on its own: a 2006 state tracer found 32% finding work within a year of passing out. [42,36]
Who actually enters an ITI, by school level— answered. The government’s tracer study puts 54.3% of entrants at Class 12 or above before joining, against 35.9% at Class 10. [14] What is still open is whether the same holds outside the government ITIs that study covers, which are 95% of its sample.- Whether a graduate’s wait really ends when the exam age limit closes. The pattern fits; we have not tested it directly. [59]
- Why the general degree’s whole age profile has slipped 3 to 5 points in seven years while the polytechnic’s has risen 10. The drift is measured; the cause is not, and it decides how much of the 35-to-40 snapshot a 25-year-old today should believe. Part-answered. The obvious mechanical explanation is ruled out: the sex mix of both routes moved, the general degree feminising and the polytechnic doing the reverse, but that composition accounts for at most 2 points of any drift. What is left is a real within-sex change, and for the general degree it sits in mid-career rather than at entry, which points at what happens to graduates after the first job rather than at the quality of new ones. Why that is, this cannot say. It also puts a caution on the polytechnic’s own number: the +10 at 35 to 40 rests on 45 sampled women. [54]
- How many polytechnic students leave early, and how many transfer into engineering degrees. The 0.8 to 1.6 lakh a year we quote is what the transfer quota allows, not a count. Bounded, not counted. AICTE publishes no transfer or dropout field, so the second half stays open, but its panel does bound the first: against 3.09 lakh diploma passouts in 2021-22, the quota-derived range would mean 26 to 52% of every diploma holder in the country moving into a degree, which reads as an upper bound nobody approaches. On attrition, comparing enrolment with passouts two years later gives a completion rate of 51 to 72%, median 62%, across the eight usable years. That is a synthetic cohort rather than a tracked one and should be read as a bound. Two of the eleven published years are unusable and the data says so itself: 2020-21 reports more students placed than passed, and 2022-23 was still filling. [70,71]
- How people enter a polytechnic: straight after Class 10, or laterally after Class 12. The survey cannot see it, and not because of missing answers. It records only the highest general level a person reached and ranks the diploma course above higher secondary, so of 3,667 sampled diploma holders aged 25 to 44 not one carries a Class 10 or Class 12 code: 79% are coded as the diploma course itself and the rest as graduate or postgraduate. The entry route is erased when the answer is coded, so only admission records can settle it. If a large share now enter after Class 12, that changes who recommendation 3 should be aimed at. One thing now bounds it: the ITI-to-polytechnic lateral route is capped at 20% of seats by policy, and a 2016 committee recommended removing the ceiling without it being removed, so at least that part of lateral entry cannot be more than a fifth. [72,36]
- What happened to the B.Voc degree and to certificate-carrying degrees generally. No evaluation exists. [55]
- How many people are still in a job twelve months after being counted as placed. Nobody publishes it. [39]
- What apprenticeships lead to. The only transition figures we found are self-reported by the industry body that promotes the scheme, and there is no independent tracer of stipend levels, conversion to permanent rolls, or pay five years on. [44]
References
Section titled “References”Numbers in square brackets point here. [W] marks a figure we computed ourselves from survey or
administrative data; the link goes to the query and its output in this repository, so anyone can
re-run it. The query is in this repository; its output CSV is hosted in the analysis bucket, because
row-level data is not committed here. Other entries link to the document they come from. Entries marked Opened with a date
were read in the document itself on that date, and the copy that was read is archived, with its
hash, in SOURCES.md. [download] after such an entry is the copy that was
read; it opens only for someone signed in with an avantifellows.org Google account, and the source URL in
the entry is the official one. Entries still carrying “search-excerpt reading” were never
opened by the research passes that found them and should be checked against the document before
being quoted anywhere else. [Persona, verify] marks something a participant in
our internal debate said from experience. It is not sourced to any document here. Treat it as a
lead.
Some working documents are named here without a link, and that is deliberate. DEBATE.md, the
five debate/r1_*.md position papers and CRITIQUE.md are internal: the first six are a structured
argument between written characters, not interviews, and the last is review notes on an early
draft. They are named so a reader can see exactly where an unsourced claim came from, and they are
not published, because putting invented personas beside a policy argument would present them as
testimony. Everything the paper actually rests on is published with it.
- [W] The plain-English restatement of this argument, tested claim by claim against the survey data:
SENSE_CHECK.md, queries insql/10_sense_check.sql. - Four independent critiques of the earlier draft, covering methods and evidence, implementation and public finance, the case for the ITI push, and equity, with four further data checks run in reply:
CRITIQUE.md. - Five personas (a senior skills and higher-education official, a Department of Expenditure official, a state minister, a labour economist, an industry human-resources head) argued the draft and its recommendations:
DEBATE.md, position papers indebate/. - [W] PLFS calendar 2025, everyone aged 25–34, by sex and school level: share working, in a regular salaried job, in a job with a contract or social security, looking for work, and at home. Query
sql/10_sense_check.sql(a); outputdata/sense_a_cohort_status.csv. - [W] PLFS calendar 2025, ages 25–54 in five-year bands, by sex: share of the whole band in a regular salaried job, and share holding one that pays ₹25,000 or more and ₹50,000 or more a month. Query
sql/12_over_25k_and_employability.sql(a); outputdata/over_25k_by_age.csv. The ₹25,000 line is in nominal 2025 rupees and is not deflated across bands; whole-population shares combine the male and female rows on their population weights. - [W] PLFS calendar 2025, everyone aged 25–34: what each person mainly did over the year, as shares of the whole age group. Unemployed 3.4%, at home and not looking 30.5%, self-employed 19.7%, casual daily wage 13.4%, unpaid family work 9.4%, studying 1.3%, other 1.4%, on a payroll with no contract or social security 9.3%, on a payroll with one 11.6%. The nine shares sum to 100. Query
sql/13_people_and_cohort_stability.sql(c); outputdata/waterfall_25_34.csv. - [W] PLFS calendar 2025, ages 25–29: school level of everyone without a regular salaried job, and of everyone looking for work. Query
sql/10_sense_check.sql(b); outputdata/sense_b_not_salaried_composition.csv. - [W] PLFS calendar 2025, ages 25–44 by qualification: share self-employed, in unpaid family work and in a regular salaried job, with the exact weighted median each pays, plus the ten-release trend in the self-employed share and its median at 25–34. Queries
sql/14_self_employment.sql(a) and (e); outputsdata/selfemp_by_qual.csvanddata/selfemp_trend.csv. Self-employed earnings areern_self, gross takings over the last 30 days; salaried earnings areern_reg, the preceding calendar month. The two are comparable in magnitude and are never pooled into one median. Negative values are losses and are excluded from the median; the zero-or-loss share is reported separately and runs 16.4% for self-employed general graduates at 25–34 against 4.5% at 35–44. - [W] PLFS calendar 2025, ages 25–44: own-account work (
pas = '11', working alone) separated from employing someone (pas = '12'), by qualification, with the exact weighted median each pays. Querysql/14_self_employment.sql(b); outputdata/own_account_vs_employer.csv. 8.3 crore own-account against 76 lakh employers. - [W] PLFS calendar 2025, own-account workers aged 25–44 by occupation family, with the median each pays and the share holding formal vocational training or a technical qualification. Query
sql/14_self_employment.sql(c); outputdata/own_account_occupations.csv. Families are built from the NCO 2015 code and never from the label, because two codes can share one. The technicians row is 249 sampled people, so read its median as an order of magnitude. - Economic Survey 2025-26, Statistical Appendix, Table 4.3, All India Consumer Price Index Numbers, pp. 88-89: CPI Combined, base 2012=100, annual average. 2018-19 = 140, rising to 193 in 2024-25, a rise of 37.9%. https://www.indiabudget.gov.in/economicsurvey/doc/stat/tab4.3.pdf. Calendar 2025 is not published as an annual average on that base: the twelve 2025 months on the new 2024=100 base average 102.75, which the published Combined linking factor of 0.5267 puts at 195 on 2012=100, giving 39.3% from 2018-19. Base-change and linking factors from PIB Release 2227012, MoSPI, 12 February 2026, the first release on base 2024=100; December 2025 was the last month published on 2012=100. Series and arithmetic in
data/cpi_annual.csv. Document opened 13 September 2026. - [W] PLFS, ten releases 2018-19 to 2025: median monthly pay of men aged 25–34 in regular salaried jobs, by qualification. Query
sql/10_sense_check.sql(d); outputdata/sense_d_wage_trend.csv. Nominal rupees. PLFS collects no price index, so the real-terms comparison uses the Economic Survey series in the consumer-price reference; the dashed line on the chart is ₹12,700 in 2018-19 carried forward on that index. - [W] PLFS calendar 2025: people with Class 10 or Class 12 and no technical qualification, with and without full-time formal training, at 25–29 and 35–44: share in a regular salaried job, with a contract, with social security, in casual work, in a government job, and median pay.
CREDENTIALS_AND_NCVT.md§1.4, queries in its §6. - DGT / Ministry of Skill Development and Entrepreneurship, Tracer Study to Assess Employment Outcomes of ITI Pass Outs from the Skills Strengthening for Industrial Value Enhancement (STRIVE) Project, May 2024, conducted by Deloitte Touche Tohmatsu India with World Bank input. https://dgt.gov.in/sites/default/files/National%20Tracer%20Study%20-%20STRIVE.pdf. Document opened and read 14 September 2026. 11,136 pass-outs of the August 2022 batch surveyed September 2023 to January 2024, from a universe of 1,14,716 STRIVE pass-outs across 424 ITIs. The 51% is of the economically active, not of all pass-outs: 9,495 (85.3%) were economically active, of whom 31.6% were wage-employed, 7.9% self-employed and 9.5% in an apprenticeship, leaving 51% unemployed but available for work. Against all 11,136 surveyed the unemployed share is 43.5%, so the word “available” has to stay in any sentence quoting it. Entry education: 54.3% Class 12, 35.9% Class 10, 7.2% graduate. Three limits: 397 of the 424 sampled ITIs (95.2%) are government, so it says nothing about private ITIs and supports no government-versus-private comparison; it is unweighted, with voluntary participation and substitution across ITIs and states, so its stated 95% confidence and ±1% precision are stronger than the design supports; and it measures outcomes one year after pass-out.
- [W] PLFS calendar 2025, ages 35–40, everyone: share in the labour force, share in a regular salaried job, share in a government job and exact weighted median pay, by qualification. Query
sql/13_people_and_cohort_stability.sql(a); outputdata/worth_35_40_people.csv. Pooling both sexes lowers every level and re-orders two rows against the within-sex table, because the pathways differ sharply in how many women they hold (polytechnic 10%, trained general graduate 46%); ranking claims therefore usesql/06. - [W] PLFS calendar 2025, men 30–44, share in a regular salaried job within each fifth of household spending per person (households joined on hh_id + release_id + segment). Query
sql/08_within_quintile_men_30_44.sql; outputdata/within_quintile_men_30_44.csv; discussion inCRITIQUE.md§3.3. - [W] PLFS calendar 2025, own-account craft and trades workers aged 25–44 (NCO major group 7), by formal against informal training, within sex and within trade. Query
sql/14_self_employment.sql(d); outputdata/own_account_craft_by_training.csv.voc = '1'is formal training;voc2–5 are informal kinds (hereditary, self-taught, on the job, other);voc = '6'is none. Pooled across sex this cell reads as though formal training LOWERS earnings, which is a composition artefact: formal training in own-account craft is 67% women and 65% garment trades. The men’s formal-training cell is 370 sampled and the no-training cell 182, so the ₹18,000 against ₹16,000 is a direction rather than a precise gap. - [W] PLFS calendar 2025, ages 25–29, scaled to a 2.5 crore birth year. Query
sql/01_flow_25_29.sqlwith the definitions insql/00_bucket_case.sql; outputdata/flow_25_29.csv; method inREADME.md; the 38.9% who never passed Class 10 is re-derived inREVERIFICATION.md§3. - Two write-ups of AICTE’s own data, both Opened 14 September 2026. R. Radhika, “BTech in India: Waning seats, declining enrolment, shows AICTE data”, Careers360, 27 April 2023. https://news.careers360.com/btech-engineering-college-aicte-data-course-placement-admission-graduation-aishe-vacant-seats. The Education Ministry told Parliament that 33.6% of undergraduate engineering seats were unfilled in 2021-22, 44% in 2020-21 and 44.2% in 2019-20; AICTE’s table has 14.11 lakh enrolled against an approved intake of 25.39 lakh in 2021-22. The 64% is not a national figure: it is the average graduation rate for the 2018-19 intake across the states with the highest seat shares, graduating in 2021-22, from a table of eight states: Tamil Nadu 69.7%, Karnataka 81.2%, Kerala 35.9%, Andhra Pradesh 67.3%, Telangana 51.9%, Maharashtra 85.4%, Uttar Pradesh 58.6%, Delhi 62.2%. An earlier draft called it “one recent intake” without the qualifier. Fareeha Iftikhar, “India’s engineering courses are losing their sheen”, ThePrint, 7 March 2025. https://theprint.in/india/education/indias-engineering-courses-are-losing-their-sheen-low-enrolment-placement-rates-present-grim-picture/2538476/: of 6.49 million undergraduate engineering seats sanctioned between 2019-20 and 2023-24, 1.94 million (30%) went unfilled; of 3.43 million enrolled between 2019-20 and 2022-23, 1.64 million (47.7%) were placed. Neither source splits government from private; that comes from the warehouse fill by ownership in
HYPOTHESIS.md§1.2. Archived copy and SHA-256 inSOURCES.md. download 1, download 2 - MERITE: Press Information Bureau release 2154119, Union Cabinet, 8 August 2025. A Central Sector Scheme of ₹4,200 crore for 2025-26 to 2029-30, of which ₹2,100 crore, exactly half, is a World Bank loan; 275 government and government-aided institutions, being 175 engineering institutions and 100 polytechnics, and about 7.5 lakh students. Document opened and confirmed 13 September 2026.
- PRS Legislative Research, Demand for Grants 2026-27 Analysis: Education (PDF): MERITE is allocated ₹300 crore in 2026-27, about 72% of the Ministry’s entire research-and-innovation line of ₹418 crore, against an average utilisation of 47% on that line between 2017-18 and 2024-25. Ministry of Education total ₹1,39,289 crore, school education ₹83,562 crore and higher education ₹55,727 crore; UGC and AICTE share one budget line of ₹3,939 crore. Document opened and confirmed 13 September 2026.
- [W] PLFS calendar 2025, ages 25–34: share of each qualification’s holders living in towns. Query
sql/10_sense_check.sql(e); outputdata/sense_e_urban_share.csv. Where holders live, not where the colleges are. - Two research passes found no central programme for post-degree diplomas beyond IGNOU, NIELIT and C-DAC.
HYPOTHESIS.md§2;LITERATURE.md, ‘Not found in any pass’. - Government-job preference among 15-to-34-year-olds, from the CSDS-KAS youth surveys. Opened 14 September 2026. 2016: 65% would prefer a government job if given a choice, own business 19%, a private-sector job 7%; CSDS-KAS Youth Survey 2016, 6,122 respondents in 19 states; Key highlights from the CSDS-KAS Report, 3 April 2017, p. 2. https://www.lokniti.org/media/upload_files/KeyfindingsfromtheYouthStudy.pdf. 2021: 55% chose a government job, about a quarter their own business, 9% a private job; Indian Youth: Aspirations and Vision for the Future, CSDS and Konrad-Adenauer-Stiftung, 6,277 respondents in 18 states surveyed July to August 2021, pp. 15 and 100, Figure 5.28. https://www.kas.de/documents/264392/264441/Youth+Report.pdf. An earlier draft carried “three in five in 2023”, cited to https://www.lokniti.org/content/Lokniti-CSDS-Survey. That page is Lokniti’s Social and Political Barometer 2023, an electoral survey of 7,202 voters with no job-preference question, and the citation is withdrawn. The study the press reported as three in five is Indian Youth in the Post-Pandemic World: Issues of Livelihood, Education and Mental Health, released 26 July 2023 on a sample of 9,316 in 18 states. Neither organisation publishes its report: Lokniti hosts only the questionnaire, headed Youth and Mental health 2022, and every Konrad-Adenauer-Stiftung document path for it returns 403. Note that the fieldwork is 2022 even in the press’s “2023”. Since the figure cannot be read in a document, the paper does not use it. Settled 15 September 2026: the barometer PDF was read end to end and its 33 questions are all electoral and political - voting intention, leaders, party performance, government schemes, trust in institutions. It contains no question about job preference at all, so that citation did not merely fail to verify: it pointed at a survey that never asked. Archived copy and SHA-256 in
SOURCES.md. download 1, download 2, download 3, download 4 (superseded, kept for the record: download 1, download 2) - [W] PLFS, ten releases 2018-19 to 2025, ages 25–54 in regular salaried work: government’s share of all salaried jobs, of jobs paying ₹25,000 or more and ₹50,000 or more, and by rural and urban; plus exact weighted median pay for government against private. Query
sql/11_why_government.sql; datadata/sense_f_govt_quality.csvanddata/sense_g_govt_vs_private_pay.csv. - [W-derived compilation] Which government posts each qualification opens, the pay level, and applicants per vacancy:
CREDENTIALS_AND_NCVT.md§2, assembled at search-excerpt level from Railways, Staff Selection Commission and state commission notifications and news reports. Check the notification before quoting any single figure. - [W] PLFS calendar 2025, ages 25–54: general graduates hold 23.4% of all government jobs, and 10.4% of general graduates have one.
CREDENTIALS_AND_NCVT.md§1.1. - [W] PLFS, ten releases 2018-19 to 2025, ages 25–54: government jobs, all regular salaried jobs, government’s share of them, the share of government employees aged 25–34, and the contract mix inside government. Query
sql/10_sense_check.sql(c); outputdata/sense_c_government_trend.csv. - [W-derived] Polytechnic ownership and capacity: government holds about 35% of approved polytechnic intake, in
data/ownership.csv. AICTE figures reported via Careers360 put the system at 3,566 polytechnics, 59% of them private, with seats 33–48% empty and enrolment falling. MERITE covers 100 polytechnics. See also reference on the 2008 scheme. - [W-derived] Approved intake by institution type and ownership, assembled from the AICTE 2021-22 approved-intake register plus the AISHE, NMC and UDISE+ counts: government holds about 35% of approved polytechnic intake.
data/ownership.csv; method and the estimated rows inREADME.md. Estimated rows apportion by institution count, which overstates the private share, so read the government figure as a floor. - [W] AICTE 2021-22 approved intake and enrolment by state (
aicte_fact_intake): diploma seats filled 35% in Tamil Nadu, 34% in Punjab, 33% in Rajasthan, 45% in Uttar Pradesh, against 77% in Kerala, 76% in Odisha and 71% in Bihar. Tamil Nadu’s 1,15,572 empty diploma seats are 24% of the national total.REVERIFICATION.md§9; national fill by ownership inHYPOTHESIS.md§1.2 anddata/ownership.csv. - [Persona, verify - downgraded 15 September 2026] From the stated experience of the implementation critic and the senior-official personas:
CRITIQUE.mdAppendix B;debate/r1_ias_secretary.md;debate/r1_expenditure.md. A pass looking for documents found none for the headline proportions, and they are not repeated as fact: that state technical-education budgets run 85 to 90% salaries and pensions, that a large state’s directorate spends ₹1,000 to ₹2,000 crore a year, that guest lecturers are paid about ₹25,000 a month, and that many states never adopted the AICTE pay scales after central reimbursement lapsed. State finance accounts and a state directorate’s own budget would settle them; neither was opened. The ₹8,000 to ₹12,000 crore a year that fee reimbursement and the Post-Matric Scholarship send to private professional colleges is the same kind of estimate and is the first item in section 14’s open questions.
What is documented points the same way, and is cited separately rather than folded in here. Karnataka has 307 of 646 sanctioned teaching posts vacant across its government engineering colleges with no recruitment since 2010, guest faculty filling the gap, and the regulator cutting the intake of three colleges (the Karnataka reference). Technical education takes 2.6% of state education-department budgets against 14.0% of the Centre’s (the budget-expenditure reference). Neither establishes the salary share, and the paper should not be read as if they did.
33. [W-derived compilation] Typical yearly fees for each route, government and private, with the page for each figure: data/fees.csv, shown in the fees table on the page. Search-excerpt readings except where they match the warehouse fee table (collegefees_fact_costs).
34. [Costing, part measured] The recommendations’ unit costs, in RECOMMENDATIONS.md. Two of the three were from memory and both are now computed from published rates, on 15 September 2026. They were wrong in opposite directions and very nearly cancel.
The teaching post, previously “about ₹12 lakh fully loaded”. A directly recruited Lecturer in a polytechnic enters at a basic of ₹56,100 a month, Academic Level 9A, under the AICTE regulations on pay scales for diploma-level institutions, 2019 (https://coer.ac.in/wp-content/uploads/2020/06/AICTE-Diploma-Pay-Scales-Qualifications-and-Promotions.pdf); Level 10 is ₹57,700. Dearness allowance is 60% of basic from 1 January 2026 (Cabinet decision, PIB release 2253245, 18 April 2026). With House Rent Allowance at the 7th Pay Commission slab and the employer’s National Pension System share at 14% of basic plus dearness allowance, the loaded annual cost is ₹12.95 lakh in a Z-class town, ₹13.63 lakh in a Y-class city and ₹14.30 lakh in an X-class metro. So about ₹13 lakh, not ₹12 lakh - the estimate was 5 to 8% low, and since this is the largest line it pushes the five-year total up rather than down. The two rates that are not themselves documents are flagged in SOURCES.md.
The women’s hostel, previously “about ₹15 crore for 200 beds”. The Ministry of Social Justice and Empowerment’s hostel scheme guidelines, revised 2017-18, set a construction cost norm of ₹3.00 lakh per seat for most of the country, ₹3.25 lakh in the Himalayan regions and ₹3.50 lakh in the North East (https://socialjustice.gov.in/writereaddata/UploadFile/Guidelines%20Hostel%20Scheme%20(Revised%202017-18)636439278258795470.pdf), against a built-up area of 12.15 square metres a seat. 200 beds is therefore about ₹6 crore, not ₹15 crore, on a 2017-18 norm that construction inflation has since raised. The polytechnic scheme’s own figure is lower still: central assistance for a women’s hostel is capped at ₹1.00 crore per polytechnic, against ₹12.30 crore to build an entire new polytechnic and ₹2.00 crore to upgrade one, read in the Standing Committee’s Third Report, p. 33. So the paper’s hostel line was about 2.5 times the government’s own per-seat norm, and the ₹15 crore it used exceeded what the same ministry budgets for a whole new institution.
The 2009 pay-revision precedent is real in outline - the Centre met 80% of the additional expenditure of the AICTE pay revision and states the remaining 20% - but the order itself has not been opened and is not relied on for any figure. Archived copy and SHA-256 in SOURCES.md. download 1, download 2, download 3
35. PM-SETU: Press Information Bureau release 2243982, Ministry of Skill Development, Lok Sabha written reply, 23 March 2026. ₹60,000 crore over five years, split Centre ₹30,000 crore (half of it a multilateral loan), states ₹20,000 crore, industry ₹10,000 crore; ₹1,237.58 crore approved as of the reply. Read in full: https://www.pib.gov.in/PressReleasePage.aspx?PRID=2243982. ₹1,237.58 crore against ₹60,000 crore is 2.06%, which is where this paper’s “about 2% of its outlay in its first year” comes from. It is not a World Bank figure and does not come from the appraisal document; a research brief mis-attributed it and the attribution is corrected here. Notes in HANDOFF_PASS2.md (an internal hand-off, not published) and HYPOTHESIS.md §2.7.
36. NITI Aayog, Transforming Industrial Training Institutes, January 2023 (the file name reads 02022023; the cover and citation page say January). https://niti.gov.in/sites/default/files/2023-02/ITI_Report_02022023_0.pdf. Document opened and read 14 September 2026. A qualitative diagnostic, not a survey: 40+ principals, 100 instructors and 1,000+ trainees, with no sampling frame and no weighting, plus an analysis of the NCVT MIS dashboard. Taken from it: 36% of sanctioned instructor posts filled (§6.3, §8.1.6), on the July 2022 dashboard, ranging 14% in Andhra Pradesh to about 90% in Tripura; 14,789 institutes as at 22 September 2022, 3,194 government and 11,595 private, with seat utilisation 56.74% government against 43.07% private (Table 1); 990 institutes, 8%, meeting the STRIVE grading threshold, average grade 1.41 of 5; about ₹10,000 crore a year of public spending on government institutes; and a 20% ceiling on ITI entry to the second year of a polytechnic (§3.2). Its 0.09% placement figure is withdrawn from this paper: it counts placements recorded on a dashboard the report itself says is not updated (footnotes 11 and 12), and the same report’s field visits put placement at 80%+ in high-graded institutes and 20–60% in the rest (§5.3.1). Its ₹1.32 lakh per student is per year for 20 government institutes in Delhi and Faridabad in 2020-21, not a national figure, and is high mainly because seat utilisation in that sample was 39.9% (Table 3). download
37. [W] PLFS 2018-19 and calendar 2025, men aged 25–34 by qualification: share of all men in that group who hold a regular salaried job, and share holding one that pays ₹25,000 or more. Query sql/12_over_25k_and_employability.sql (b); output data/employability_by_group.csv. The trained school-leaver group is small in 2018-19 (274 men), so read its 52% then against 47% now as flat rather than falling.
38. [W] PLFS calendar 2025: school level of people aged 18–24 and 25–34 who report full-time formal training of three months or more and hold no technical diploma or degree. Query sql/07_trainee_school_level.sql; output data/trainee_school_level.csv. A proxy for who enters an ITI: it also counts other full-time courses. Caveats in CRITIQUE.md §3.2.
39. [Persona, verify - except the pay, which we can measure] Industry human-resources head, from stated experience: debate/r1_industry_hr.md. Checked 15 September 2026, and split into what our own data can settle and what nothing here can.
The pay claims are now [W] rather than testimony. PLFS calendar 2025, exact weighted median monthly pay of those in regular salaried work, at ages 25-29 and again at 35-44, which is roughly entry and ten years on: polytechnic diploma ₹18,000 → ₹28,000, engineering degree ₹35,000 → ₹55,000, general graduate ₹18,000 → ₹28,000, Class 12 with vocational training ₹15,000 → ₹22,500, Class 12 alone ₹15,000 → ₹16,000, Class 10 alone ₹14,000 → ₹15,000. Query sql/02_worth_by_band.sql; output data/worth_by_band.csv. Note what this shows and the persona did not: the diploma and the general degree start and finish at the same wage, and the two school-only routes barely move at all.
Not verifiable from anything in this folder, and left as leads: how much of a plant’s workforce sits on a contractor’s payroll, twelve-month retention after a placement is counted (nobody publishes it - it is why recommendation 7 exists), what an NCVT certificate signals to a recruiter, and the claim that about 40 of 3,500 polytechnics are actually hired from. That last is the most quotable number in the persona’s evidence and the least supported; it should not be repeated without a source.
40. [W] PLFS calendar 2025, ages 18–24: rural and urban split of people in full-time formal training of three months or more with no technical qualification, against the rural/urban split of the age group, by school level. Query sql/12_over_25k_and_employability.sql (c); output data/trainee_rural_urban.csv. Where trainees live, not where institutes are: PLFS is a household survey and carries no institution location, so the distribution of ITIs themselves is untested here.
41. World Bank, Implementation Completion and Results Report: Skills Strengthening for Industrial Value Enhancement (STRIVE) Operation, Report ICR00105, Operation P156867, IDA Credit 5965-IN, 1 May 2025. https://documents1.worldbank.org/curated/en/099050625173546044/pdf/BOSIB-86ca4a4b-bcf3-4b0a-a02b-3b78218f12f8.pdf. Document opened and read 14 September 2026. An earlier draft said STRIVE spent ₹712 crore of ₹2,200 crore, which mismatched a real numerator with the wrong denominator. Para 62: ₹711.65 crore is 92% of the ₹773 crore actually released. Annex 3, p. 26: total financing came to US$95.26 million against US$318 million at appraisal and US$95.84 million as revised, so 30% of the original and 99% of the revised, after US$33 million was cancelled across four restructurings. The Centre pledged US$193 million of counterpart funding and contributed US$3.84 million, 1.99%. Also taken: the employment indicator was revised down from 65% to 50% and the tracer’s 49% still missed it; grants were capped at ₹2 crore an institute, which para 52 says left funded institutes at a financial disadvantage against unfunded ones raising private and corporate money, with Scheduled Tribe enrolment half a point below the national ITI average; first disbursement came 30.5 months after board approval (para 49); and para 70 recommends more financing for civil works, which runs against this paper’s direction and is reported rather than omitted.
42. Directorate of Training and Employment, Government of Uttar Pradesh, with DGT, Tracer Study of ITI Graduates in the State of Uttar Pradesh, December 2023, conducted by TransRural Agri Consulting; published on dgt.gov.in May 2024. https://dgt.gov.in/sites/default/files/2024-05/Tracer%20Study%20of%20ITI%20Graduates%20in%20the%20state%20of%20Uttar%20Pradesh.pdf. Document opened and read 14 September 2026. 9,644 graduates of the 2022 All India Trade Test from 321 of Uttar Pradesh’s 3,210 institutes, 69% government and 31% private, traced one to one and a half years after passing. Denominator is the whole sample, not the economically active: 8.7% employed, 0.6% in apprenticeship, 22.3% not looking, 68.4% unemployed (Table 1.1). By institute type, employment runs 22.4% at private STRIVE institutes, 11.3% at government STRIVE, 9.4% at private non-project and 7.4% at government non-project; the private-project cell is 57 people from four institutes. Joining pay averages ₹11,500 a month and current pay ₹14,400. Not weighted; unreachable graduates were replaced by randomly drawn alternates rather than adjusted for, and most interviews were conducted in the presence of institute staff, which is a problem for the satisfaction items more than the employment ones. An earlier draft of this paper cited 30.5% placed from this study. That figure is not in the document and has been removed.
43. NEEM discontinuation, 2022. The NEEM apprenticeship scheme was discontinued in December 2022 after the provident fund authority ruled its trainees were not exempt from counting as employees. https://ksandk.com/newsletter/neem-to-be-discontinued-with-immediate-effect/. Search-excerpt reading; open the document before quoting.
44. TeamLease Degree Apprenticeship, 2025. An industry report claims about a million apprentices in ten years and a 98% transition to formal employment, self-reported. https://mediabrief.com/women-apprentices-surge-58-in-three-years-to-197000-teamlease-degree-apprenticeship-report/. Search-excerpt reading; open the document before quoting. Also The Wire; Careers360 (PM Internship), 2026. The PM Internship scheme spent ₹87 crore of ₹10,831 crore, with 24,600 of 83,000 offers accepted. https://m.thewire.in/article/economy/only-1-5-of-funds-used-the-pm-internship-scheme-has-missed-its-targets-by-a-wide-margin. Search-excerpt reading; open the document before quoting.
45. World Bank, Program Appraisal Document on a Proposed Loan in the Amount of US$830 Million to India for a Supporting Pradhan Mantri Skilling and Employability Transformation through Upgraded ITIs Program, Report No. PADHP00147, 5 January 2026, Operation P507910. https://documents.worldbank.org/curated/en/099010826174039680/pdf/BOSIB-cbe20117-dde5-4621-bac3-3e34c1896433.pdf. Opened and read 14 September 2026. Found by listing the operation’s documents through the Bank’s search API rather than by name: it was prepared as Skills: National ITI Upgradation Program (NITIUP) and filed under the PM-SETU-era title. A Program-for-Results supporting a US$4 billion programme (counterpart US$1.644 billion, Asian Development Bank US$846 million, World Bank US$830 million, industry US$680 million) to reorganise 1,000 government ITIs into hub-and-spoke clusters; 1.3 million youth trained by closing, 25% of them women against 13.3% of enrolment today; only 55% of India’s 2.6 million ITI seats are filled, 66% in government and 48% in private ITIs. Six disbursement-linked indicators, Table 3: DLI 1, improved employment outcomes for graduates of supported ITIs, US$277 million; DLI 2, access to better-quality training, US$184 million; DLI 3, governance and management of supported ITIs, US$184 million; DLI 4, subnational governance, US$92 million; DLI 5, quality of training at the national trainer institutes, US$46.5 million; DLI 6, national governance, US$46.59 million. So the largest indicator is an employment outcome. Its verification protocol defines the employment rate as the share of graduates, male and female, across all operational clusters who are “either wage-employed or self-employed”, measured by an annual census-based graduate tracer survey and checked by the Independent Verification Agency through desk review, phone and field surveys on a stratified random sample of clusters; it pays from the third year, US$46.5 million then and US$46 million in each of years four and five, scaled by the share of clusters meeting the target. It sets no wage floor, which is what recommendation 5 now asks for. An earlier draft cited a documents1 URL that resolves to the Rajasthan Highway Modernization Project, Report PADHI00658; that citation was withdrawn and this one replaces it. The final Environmental and Social Systems Assessment (6 January 2026) is archived alongside. Archived copy and SHA-256 in SOURCES.md. download 1, download 2, download 3, download 4
46. National Council of Applied Economic Research, Mid-term Progress Review of Centrally Sponsored Scheme “Upgradation of Existing Government Industrial Training Institutes into Model ITIs”, Bornali Bhandari, Rajesh Chadha, D. B. Gupta, Ajaya Kumar Sahu and Sudhir Swarup, for the Ministry of Skill Development and Entrepreneurship, 1 November 2018, covering 2014-15 to 2017-18. Opened and read 15 September 2026: https://ncaer.org/wp-content/uploads/2022/10/Upgrading_Model_ITI_Final.pdf. Executive summary and §3.2: “A larger share of the ₹20.77 crore utilised so far had been devoted to civil works (57.9 per cent) and equipment purchase (31.3 per cent).” The denominator is money spent, not money allocated, by the 16 of 21 sampled Model ITIs that had spent anything as of 31 December 2017; only nine of the 21 had received half their allocation and only four had used more than half of what they received. The sharper finding is the one the bare percentage hides: “The scheme guideline says that 25 per cent of the total funds should be spent on civil works, 50 per cent on equipment, seven per cent on furniture, five per cent on learning materials and ten per cent on recurring expenses.” The spend inverted the design. Eleven of the sixteen spent nothing on learning resources; three spent their entire utilisation on civil works and two entirely on equipment. An earlier draft cited the figure to Mehrotra’s Technical & Vocational Education and Training in India, Azim Premji University CSE Working Paper 37, February 2021 (https://publications.azimpremjiuniversity.edu.in/4333/1/Mehrotra_TVET_India_Feb_2021.pdf), which was opened and does not contain it; the same author relayed it in The Wire, 7 February 2025, which is how it reached the paper. Both are archived alongside the primary. Archived copy and SHA-256 in SOURCES.md. download 1, download 2 (superseded, kept for the record: download 1, download 2)
47. Lokniti-CSDS, Kota Study 2023: Issues of Mental Health Amongst Students in Kota, survey findings, 1,002 students. Opened and read 15 September 2026. https://www.lokniti.org/media/upload_files/Kota%20Study%202023-Issues%20of%20Mental%20Health%20amongst%20students%C2%A0in%C2%A0Kota-Survey%20Findings.pdf. Of the 1,002, 58.9% were preparing for NEET and 34.7% for JEE (Q3). Annual coaching fees, including material: 72.8% pay ₹1 to 2 lakh, 11.2% pay ₹2 to 3 lakh and 3.3% more than ₹3 lakh - so about 87% pay a lakh or more, for one year of preparation, before any college fee (Q20). 48.7% were on a first attempt, 26.4% a second, 13.2% a third and 1.6% a fourth or later, with 10.1% not answering (Q14); 85.2% spend six to seven hours a day in the institute (Q19). Asked what they would do if they did not pass, 29.9% said they would clear it “no matter what”, 10.7% had no plans and 9.4% had not thought about it (Q43). Read it for what it is: students currently in the most intensive coaching town in the country, self-selected and surveyed while still in it, so it describes the inside of that funnel rather than the average aspirant. The survey exists to measure mental health, and the figures used here are its background questions. download
48. [W-derived] Government and private seats or graduates for each qualification, from AICTE 2021-22 approved intake by type of institution, NMC 2024-25 MBBS seats, AISHE 2023-24 output apportioned by who owns the colleges, UDISE+ enrolment for the school rows: data/ownership.csv, each row carrying its basis and confidence; queries in sql/05_ownership_inputs.sql. Rows built by counting institutions are floors, not measurements.
49. Department-related Parliamentary Standing Committee on Education, 364th report, March 2025 (with the 348th, March 2023), via PRS, Demand for Grants 2026-27 Analysis: Education: sanctioned against filled faculty posts, IITs 11,292/6,712 (39% vacant), IIITs 1,315/599 (54%), NITs 7,483/5,277 (29%), IIMs 1,570/1,086 (31%), central universities 18,940/13,530 (29% as of 31 December 2024), total 41,351/27,133 (34%). Report PDF. These are institutional faculty posts at central institutions, not state engineering colleges and not the regulator’s own staffing. Document opened 13 September 2026.
50. Two reports in the Deccan Herald, Both opened 15 September 2026 on the paper’s AMP copies, which are not paywalled although the canonical URLs are. Rashmi Belur, “Faculty crisis at Karnataka govt engg colleges as 50% positions vacant”, 30 December 2024: “The total sanctioned faculty posts at 16 government-run engineering colleges is 646, of which 307 are vacant, as per the annual report submitted to the government by the department of technical education” - so the headline’s 50% is 47.5%, it is sanctioned against filled, and the source is the state department’s own annual report. Also: no recruitment since 2010, and 1,023 of 1,150 non-teaching posts vacant. Guest faculty are the state’s substitute, which the colleges say costs them central funds and National Board of Accreditation certification. https://www.deccanherald.com/amp/story/india%2Fkarnataka%2Ffaculty-crisis-at-karnataka-govt-engg-colleges-as-50-positions-vacant-3335698. Three earlier drafts labelled this figure unverifiable because the canonical URL is behind a subscription wall; it is not unverifiable, and the base it was missing is in the second paragraph. The lead the last pass flagged is also confirmed: “AICTE tells Karnataka to cut intake at 3 govt engineering colleges by 25%”, 18 December 2024, https://www.deccanherald.com/amp/story/india%2Fkarnataka%2Faicte-tells-karnataka-to-cut-intake-at-3-govt-engineering-colleges-by-25-3321901. An AICTE expert committee made a surprise visit to the Talakal (Koppal), Haveri and Gangavathi government engineering colleges and ordered a 25% intake cut, citing absent permanent principals, ill-equipped libraries, laboratories without apparatus and faculty shortage, with no fresh admissions until its criteria are met. That is the vacancy figure’s consequence, observed. Archived copy and SHA-256 in SOURCES.md. download 1, download 2
51. [W] PLFS calendar 2025, ages 35–40, by sex and qualification: labour-force participation, share working, share in a regular salaried job, share in a government job, median pay. Query sql/06_worth_35_40_by_sex.sql; output data/worth_35_40_by_sex.csv.
52. Jie Chen, Sanghamitra Kanjilal-Bhaduri and Francesco Pastore, Updates on Returns to Education in India: Analysis Using PLFS 2018-19 Data, IZA Discussion Paper 15002, January 2022. https://docs.iza.org/dp15002.pdf. Opened 14 September 2026. Returns per additional year of education for regular workers, p. 17 and Table 2 Panel B: secondary 4.5%, higher secondary 5.8%, graduate and diploma 9.8%, postgraduate and above 8.2%. “Graduate and diploma” is a single category in the paper (15 years of education), so the degree and the diploma cannot be separated on this evidence, and the paper does not try to. Archived copy and SHA-256 in SOURCES.md. download
53. [W] PLFS 2018-19 against calendar 2025: share in a regular salaried job at 25–29, 30–34 and 35–40 for five qualifications, everyone. Query sql/13_people_and_cohort_stability.sql (b); output data/age_profile_stability.csv. A test of whether a cross-section at 35–40 forecasts what today’s 25-year-olds will see; it shows the shape holding and the general-degree line drifting down 3 to 5 points over the seven years.
54. [W] Why those profiles drifted, decomposed. PLFS 2018-19 against calendar 2025, ages 25-40, regular-salaried share within sex, with each qualification’s sex mix and its share of the age band in both releases. Query sql/16_age_profile_drift.sql; outputs data/age_profile_drift_by_sex.csv and data/age_profile_drift_sexmix.csv. The composition explanation fails. The sex mix did move, and in opposite directions - the general degree went from 44% to 50% women at 25-29 while the polytechnic went from 19% to 13% - but holding the 2018-19 rates fixed and moving only the mix accounts for at most 2.1 points of any drift, against pooled changes of up to 10. What remains is within-sex: the general degree falls 3.8 points at 30-34 and 2.9 at 35-40 with essentially no change at 25-29, on samples of 1,300 and up. Read the thin cells as direction only: the polytechnic’s +10.3 at 35-40 and engineering’s -5.6 rest on 45 and 28 sampled women. Selection on unobservables is not separable here and is not claimed to be.
55. Anjali Jagtap-Ramteke, “Skill Development in Higher Education: A Study with Reference to B.Voc. Degree Programmes in Maharashtra”, International Journal of Science and Research 11(6), June 2022, paper SR22625010323. https://www.ijsr.net/archive/v11i6/SR22625010323.pdf. Opened 14 September 2026. A survey of government-aided institutes running B.Voc in Maharashtra: half had received only half their UGC grant-in-aid, only 30% were admitting to full capacity, admissions were declining, some had ceased programmes “due to lack of funds and low response to admission”, 44% had an industry partner for on-the-job training and 10% for teaching. It quotes AISHE enrolment rising from 544 in 2013-14 to 33,263 in 2018-19, and UGC’s order of 3 August 2016 that B.Voc be treated at par with other bachelor’s degrees for Union and State Public Service Commission and Staff Selection Commission examinations. An earlier draft said the degree “died when its funding lapsed and state commissions would not recognise it”. The recognition claim is in neither this document nor any other opened for the paper, and enrolment was growing, so both words are withdrawn. The paper’s claim that no outcome evaluation exists stands: this is a small institutional survey, not one. Also opened: IMPRI, “National Credit Framework (NCrF) 2023: Implementation and Way Forward”, 11 August 2026, https://www.impriindia.com/insights/policy-update/national-credit-framework-ncrf-2023-implementation-and-way-forward/: 196 universities had formally adopted the framework against 2,899 institutions registered on the Academic Bank of Credits, under 7%, three years after notification. Archived copy and SHA-256 in SOURCES.md. download 1, download 2
56. Kunal Mangal, Azim Premji University, from the work behind the Journal of Development Economics paper above and its VoxDev summary: in 2013 more than one in four recent college graduates in Tamil Nadu sat a government recruitment exam, and over 100,000 people in that state were unemployed and studying full time for them. An earlier draft carried “300 to over 1,000 applicants a vacancy, two to five years of preparation typical” attributed to Azim Premji University with no locatable source. That range has been removed and replaced with these two figures, which trace to an identified author and paper.
57. Kaibalyapati Mishra, Degrees of Devaluation: College Expansion and the Credential Trap in India, arXiv:2606.22620 [econ.GN], 21 June 2026. https://arxiv.org/abs/2606.22620. Document opened and read 14 September 2026. Eight NSS Employment-Unemployment rounds 1987–2011 against district college-expansion intensity from AISHE, 91 districts, six states, N = 79,904. At mean expansion intensity, non-SC/ST graduates earn about 9% less than comparable graduates in low-expansion districts and SC/ST graduates face a further penalty of about 34%, a combined shortfall near 43%. Three corrections to how an earlier draft used it. It compares high-expansion districts with low-expansion ones, not private employers with public: it therefore cannot support a claim that reserved posts are where the discount does not operate, and that framing has been removed. It measures erosion for post-2004 cohorts, not a standing level discount. And the author flags the limits of the design rather than claiming clean identification. Its headline result also cuts against any general “degrees are devalued” reading: the human-capital return to a degree stays large throughout, about 1.08 log points.
58. [W] PLFS, the same men born 1994–97 and 1998–2001 followed across six releases. Query sql/09_pseudo_panel_unemployment.sql; output data/pseudo_panel_unemployment.csv; discussion in CRITIQUE.md §3.4.
59. Staff Selection Commission, Combined Graduate Level Examination 2026, notice dated 21 May 2026, §5. Opened and read 15 September 2026. https://ssc.gov.in/api/attachment/uploads/masterData/NoticeBoards/Notice_of_adv_cgl_2025.pdf. Age is reckoned as on 1 August 2026, and the limit depends on the post: 18-27, 20-30, 18-30 or 18-32. §5.2 gives the relaxations beyond the upper limit: Scheduled Caste and Scheduled Tribe 5 years, Other Backward Classes 3 years, persons with benchmark disability 10 (13 with OBC, 15 with SC/ST), ex-servicemen 3 after deducting military service. The Combined Higher Secondary Level notice for 2026 sets a single 18-27 band with the same relaxations, reckoned as on 1 January 2026. This replaces a persona’s recollection. What it supports is narrower than a single closing age: for the largest graduate recruiter in the country the door shuts between 27 and 32 depending on the post, three years later for OBC candidates and five for SC and ST. State commissions set their own limits and are not covered by these notices. Archived copy and SHA-256 in SOURCES.md. download 1, download 2
60. Kunal Mangal, “The long-run costs of highly competitive exams for government jobs”, Journal of Development Economics 171 (2024). Ungated conference version opened and read 14 September 2026: https://www.isid.ac.in/~epu/acegd2022/papers/Kunal_Mangal.pdf, earlier titled Chasing Government Jobs. Tamil Nadu’s partial public-sector hiring freeze of 2001–2006 cut vacancies in affected sectors by 86%; the male college graduates exposed to it were about 9 percentage points less likely to be employed during the freeze, and a decade later “appear to have a lower earning capacity” and formed households later. Two precisions the paper respects: the measured effect is time not employed, with exam preparation the mechanism the author infers rather than observes; and the earnings result is hedged in the original, so it is hedged here.
61. [W] PLFS calendar 2025: what employed general graduates and polytechnic diploma holders aged 25–34 actually do, by occupation group. CREDENTIALS_AND_NCVT.md §1.2.
62. NITI Aayog, Reimagining Skilling for Viksit Bharat@2047, August 2026. https://www.niti.gov.in/sites/default/files/2026-08/Reimagining-Skilling-for-Viksit-Bharat-2047.pdf. Document opened and read 14 September 2026. Both phrases are verbatim and fall in one sentence on p. 14: “As a result, degrees are often pursued for prestige or government exam eligibility, while vocational and online pathways continue to face low trust and social stigma.” Repeated at §II Barrier 1, p. 30. Read the opening clause: the sentence follows a claim that learners lack trusted guidance, so NITI treats prestige-seeking as a consequence of weak information rather than a correct reading of the labour market. This paper disagrees with that mechanism, and says so where the quote is used. Also taken from this report: fewer than one secondary school in twelve offers vocational subjects (p. 45), 8.25% of graduates work in roles aligned to their qualification (Economic Survey 2024-25, quoted p. 32), ₹34,000 crore of skilling money across nine ministries in 2025-26 (p. 12), and ₹600 crore to the skilling ministry for the convergence scheme in 2026-27 (p. 21). Its own front matter states that NITI “does not confirm the authenticity of the data and the accuracy of the methodology used”, and BCG was knowledge partner on the surveys behind it, so treat it as a statement of how government characterises the problem rather than as a source of measurements.
63. Ministry of Education, Department of Higher Education, Analysis of Budgeted Expenditure on Education 2020-21 to 2022-23, published 2025. https://www.education.gov.in/sites/upload_files/mhrd/files/statistics-new/bud_exp.pdf. Document opened and read 14 September 2026. An earlier draft carried ₹15,533 crore for technical education in 2020-21 at 16.0% of the education budget. Neither figure is in the document and both are withdrawn; the closest cell is ₹15,837 crore, which is what state education departments budgeted for technical education in 2022-23, a different year on a much narrower basis. What the document does say, Table 2.6, Revenue Account, 2022-23 budget estimates: education departments spend ₹7,69,712 crore, of which technical education is ₹39,095 crore or 5.08%, split ₹23,258 crore at the Centre (14.01% of its education-department budget) and ₹15,837 crore in the states (2.62% of theirs). Elementary and secondary together take 81.92%. Across all departments, states carry 73.20% of public education spending and the Centre 26.80%; total public education spending is 4.06% of GDP, which independently corroborates the 4.1% this paper takes from PRS. Technical education’s share of GDP fell across the three years, 0.74% to 0.75% to 0.68%. The trap in this source: its all-departments technical total of ₹1.48 lakh crore imputes entire ministries, Health and Family Welfare, MSME, Skill Development, Science and Technology and Atomic Energy among them, wholesale into the technical sector, which is why it is nine times the education-department figure. Never quote it as spending on technical institutions, and always say which of the two bases a figure is on.
64. Standing Committee on Labour, Textiles and Skill Development (2024-25), Eighteenth Lok Sabha, Tenth Report: Action Taken by the Government on the Observations/Recommendations of the Committee contained in their Third Report on Demands for Grants (2024-25) pertaining to the Ministry of Skill Development & Entrepreneurship, presented to Lok Sabha and laid in Rajya Sabha on 6 August 2025, Recommendation Para No. 35, p. 37. https://sansad.in/getFile/lsscommittee/Labour,%20Textiles%20and%20Skill%20Development/18_Labour_Textiles_and_Skill_Development_10.pdf?source=loksabhadocs. Opened and read 14 September 2026. “The Committee find that out of 499 women’s Hostels to be constructed, only 351 have been completed; out of 295 new Polytechnics proposed to be set up, only 159 have been set up; and out of the 500 existing polytechnics to be upgraded, only 105 polytechnics have been upgraded.” Para 34 gives the scheme’s history: the erstwhile Sub-mission on Polytechnics under Coordinated Action for Skill Development, transferred from the Department of Higher Education to the skills ministry in 2017 and to the Directorate General of Training in 2018, with a sunset date of 31 March 2026; budget estimate ₹106.38 crore for 2023-24, revised to ₹78.67 crore, ₹66.55 crore spent. An earlier draft said the women’s hostels were never built. 351 of 499 were, which makes hostels the component closest to target. The draft also dated the scheme to 2008; that year is not in the report and is dropped. The news summary the draft read, Shradha Chettri, Careers360, 12 August 2025, reports the paragraph accurately. Archived copy and SHA-256 in SOURCES.md. download 1, download 2, download 3
65. Three pieces on PMKVY, all Opened 14 September 2026, and all resting on the scheme’s own reporting system, which is the caution the NCVT MIS figure earned. The 14%: Shradha Chettri, “Fix PMKVY, hold PM-SETU until foolproof”, Careers360, 17 March 2026, reporting the Standing Committee on Labour, Textiles and Skill Development’s report on the skills ministry’s Demands for Grants 2026-27: PMKVY “has utilised just 14% of the allocated budget in the 4.0 version”, PM-SETU 0.63%, the Skill India Programme as a whole 49.79%. https://news.careers360.com/pmkvy-4-0-skill-development-pm-setu-msde-flagship-scheme-overhaul-national-board-sip-budget-unspent-fund-iti-hub-and-spoke-panel/amp. The committee report itself could not be downloaded (the Parliament file server returned errors all day), so the figure stands on the newspaper’s reading of it. An earlier draft cited the 14% to Business Standard, 20 April 2025, which does not carry it; that article (https://www.business-standard.com/economy/news/house-panel-asks-skill-ministry-to-update-placement-details-under-pmkvy-4-0-125042000540_1.html) reports the earlier committee finding that placement was de-linked under 4.0, and gives 2.43 million placed of 5.7 million certified under versions 1.0 to 3.0, which is 43% of the certified. The 18%: Prachi Salve, “Govt’s Skill Development Scheme Placed Only 18% Candidates”, IndiaSpend, 19 September 2023, https://www.indiaspend.com/data-viz/govts-skill-development-scheme-placed-only-18-candidates-876460 (the URL now redirects to isignal.in): 2.4 million of 13.7 million trained in the seven years to 2022 were placed, 19.5% under 2.0 and 5.8% under 3.0. Same rupees, two denominators: 18% of those trained, 43% of those certified. Archived copy and SHA-256 in SOURCES.md. download 1, download 2, download 3, download 4 (superseded, kept for the record: download)
66. Account of what empties a government polytechnic, namely admission timing against free Class 11, a reimbursed private degree now easier to enter, dead branches, English-medium teaching after schooling in another language, no hostels, and the general degree’s flexible attendance, from the implementation critique: CRITIQUE.md Appendix B. Institutional description, marked (verify) where from memory.
67. [W] PLFS calendar 2025, ages 25–29: household spending band of each qualification’s holders. The poorest half of households is 37% of general graduates and 7% of engineering graduates; the richest fifth is 42% of polytechnic diploma holders against 31% of general graduates. HYPOTHESIS.md §1.1.
68. Post-Matric Scholarship for Scheduled Caste students, the scheme structure rather than its size. Both opened 15 September 2026. Ministry of Social Justice and Empowerment, “Government Strengthens Transparent and Timely Delivery of Post-Matric Scholarships for Scheduled Caste Students”, PIB, 7 September 2026: https://www.pib.gov.in/PressReleasePage.aspx?PRID=2307396. A centrally sponsored scheme run through the states, covering post-matriculation and post-secondary education generally, with the central share released only against the state’s share and beneficiary data verified on the National Scholarship Portal. That is why the scheme total cannot be read as money reaching private professional colleges, and why central releases, state releases and college receipts differ in any year. The release carries no expenditure figure; two national figures for 2023-24 circulate in secondary coverage and measure different things, so neither is quoted here. Jawed Alam Khan and Rahat Tasneem, Assessing Public Finance Management Issues in the Post-matric Scholarship Scheme for Scheduled Castes, Centre for Budget and Governance Accountability and the National Campaign on Dalit Human Rights, 2021: https://www.cbgaindia.org/wp-content/uploads/2022/01/Assessing-Public-Finance-Management-Issues-in-the-Post-matric-Scholarship-Scheme-for-Scheduled-Castes-1.pdf, on the 60:40 funding pattern and the group-wise rates, including the separate groups for professional courses. Archived copies and SHA-256 in SOURCES.md. download 1, download 2
69. [W] Is the self-employment penalty about self-employment, or about which industries the self-employed are in? PLFS calendar 2025, ages 25-44, exact weighted median earnings for the self-employed (ern_self, pas 11/12) against the regular salaried (ern_reg, pas 31), pooled and then within NIC industry division, keeping only divisions with 60 or more sampled earners on each side. Query sql/15_selfemp_gap.sql; outputs data/selfemp_gap_overall.csv and data/selfemp_gap_by_industry.csv. Pooled, a self-employed graduate earns 0.72 of a salaried one (₹18,000 against ₹25,000) while a Class 10 leaver earns exactly the same as one (₹15,000 against ₹15,000). Within industry division the graduate penalty disappears: the median of the 22 within-division ratios is 1.00, and in 11 of the 22 the self-employed graduate earns at least as much. For the Class 10 leaver the within-division median is 1.19, above parity in 16 of 18 divisions. The composition behind it is visible in the samples: salaried graduates sit in education (5,176 sampled) and financial services (2,001), where self-employment pays 0.60 and 0.86 of a salary; self-employed graduates sit in retail trade (2,698) and crop and animal production (2,644), the second of which has almost no salaried graduates at all (74). So the two groups are not doing the same work for different money - they are in different industries. This is a median of medians, not a formal decomposition, and selection within an industry cannot be tested here. Hours cannot be tested at all: days and hours are summed only from cells whose paired earnings cell is positive, and earnings are recorded only for casual activity, so neither of these two groups carries them.
70. [W-derived arithmetic] The 0.8–1.6 lakh a year is the AICTE lateral-entry quota (10–20%) applied to B.Tech intake: HYPOTHESIS.md §1.2. A range implied by the rules, not a count of students.
71. [W] What the AICTE panel can and cannot say about polytechnic attrition and transfer. National cut only (the three cuts cover the same population and summing double-counts), AY 2012-13 to 2022-23. Query sql/17_polytechnic_attrition.sql; outputs data/aicte_diploma_panel.csv and data/aicte_diploma_completion.csv. Diploma seats filled fell from 67.8% to 50.7% between 2012-13 and 2021-22, while placement of passouts rose from 34.7% to 63.3%. Comparing enrolment in a year with passouts two years later - the nominal length of a diploma - gives completion of 51 to 72%, median 62%. That is a synthetic cohort, not a tracked one: it assumes stable intake, mishandles the two-year lateral entrants who join in year 2, and misplaces anyone repeating a year, so it bounds attrition rather than measuring it. Two of the eleven years are unusable and the data exposes them itself: 2020-21 reports 54,072 passouts against 186,831 placed, which is 345% and therefore a broken passout figure rather than a remarkable placement rate, and 2022-23 was still filling at the pull date (3% of seats, zero passouts), as the table’s own coverage note warns. AICTE publishes no transfer or dropout field, so lateral transfer into a degree cannot be counted here at all - only bounded: 0.8 to 1.6 lakh would be 26 to 52% of the 3.09 lakh who passed out in 2021-22.
72. [W] PLFS calendar 2025, polytechnic diploma holders (tedu_lvl = '08') aged 25 to 44, 3,667 sampled: general education is coded ‘11’ (diploma or certificate course) for 79%, ‘12’ (graduate) for 17% and ‘13’ (postgraduate) for 4%. Not one row carries ‘08’ or ‘10’. gedu_lvl records only the highest general level reached and ranks the diploma course above higher secondary, so the entry route is erased when the answer is coded rather than merely unreported, and no filter on this table can recover it. Query pattern as in sql/06_worth_35_40_by_sex.sql filtered to tedu_lvl = '08'; counts re-read from BigQuery 14 September 2026. Admission records are the only route to the answer.
Appendix A. Where the numbers come from
Section titled “Appendix A. Where the numbers come from”Everything marked [W] is computed from data we hold: the Periodic Labour Force Survey person and
household files for 2018-19 through calendar 2025, AICTE 2021-22 approved intake, AISHE 2023-24,
NMC 2024-25 medical seats, NIRF 2023-24 and UDISE+ 2024-25. The queries are in
sql/ and the outputs in the analysis bucket,
so any figure here can be reproduced. Survey figures use the first visit only and the annual
weights; population estimates are shares applied to a 2.5 crore birth year rather than counts, and
the survey’s own weights sit about 16% below the population.
Everything else comes from a document, and the documents have now been opened. An earlier
version of this appendix said they had been read through a search engine, which was true of the
research runs that found them and stopped being true in September 2026. Twenty-five outside sources
were downloaded, read, and archived with a SHA-256 for each in
SOURCES.md; a reference marked Opened with a date was read in the
document itself. Opening them changed six figures and withdrew two, which is recorded in Appendix C.
Two primary documents could not be obtained and say so in the manifest, and the leads that were
never opened are still tabulated in LITERATURE.md.
Figures attributed to a persona come from the internal debate in DEBATE.md and the
position papers in debate/. Those people are written characters
representing the positions of a senior official, a budget official, a state minister, an economist
and an employer; their factual claims are marked (verify) and are not evidence.
Appendix B. The words we use
Section titled “Appendix B. The words we use”- Regular salaried job: the survey’s category for someone employed by another person or organisation on a continuing basis, as opposed to self-employed, casual daily wage, or unpaid family work.
- A job with a contract or social security: a regular salaried job that also has a written contract of any length, or provident fund, insurance or pension. The tighter test of a proper job.
- Looking for work: the survey’s unemployment category, meaning not working and seeking work. It is small at these ages, and it is not the same as not having a regular job.
- ITI certificate: a one- or two-year trade certificate from an Industrial Training Institute, entered after Class 8 or 10. In survey terms we count full-time formal training of three months or more where the person holds no technical diploma or degree; that also catches some non-ITI courses.
- Polytechnic diploma: the three-year engineering diploma below degree level, entered after Class 10 or in the second year after Class 12.
- Post-degree diploma: a diploma taken after a bachelor’s degree. A different and much stronger qualification than a polytechnic diploma, and frequently confused with it.
- General degree: BA, BCom, BSc and their postgraduate versions. No technical or professional specialisation.
- Government: central, state and local government and public sector undertakings, taken together, and including government-aided institutions where seats are counted.
Appendix C. What changed from the earlier drafts
Section titled “Appendix C. What changed from the earlier drafts”Draft v1 was written from the pooled survey figures. Four critiques and four further queries showed several of its central sentences to be wrong; v2 corrected them; v3 rewrites the whole paper in plain language after testing the argument claim by claim. [2,1] The substantive changes:
| Earlier draft | Now | Why |
|---|---|---|
| “A ratio of fourteen to one at the Centre” | 88% of new central money goes to ITIs; states fund the colleges as salaries | The ₹60,000 crore includes state and industry shares; states already fund these institutions |
| Polytechnics have the highest employment rate (92%) | Ranked within sex, on the share in a regular salaried job | Men are employed 96–100% on every route; the pooled figure measured how many women were in each |
| The general degree is “barely above” stopping at Class 12 | It pays ₹27,000 against ₹18,000 for men, and the advantage is eroding, not gone | Arithmetic, and the returns literature |
| ITIs serve those who left school at Class 10 | They are designed for them and entered by Class 12 passers and graduates | The trainee profile |
| Graduates “are right not to” switch to an ITI | The trade-off stated, and they are taking the training anyway | The claim was asserted, not derived |
| “58% of graduates work in jobs that need no degree” | Withdrawn | Occupation group does not measure what a job requires; applied evenly it indicts every route |
| Unemployment by age, read across people | The same men followed across six surveys | Separates the stage of life from the state of the market |
| A diploma mission of PM-SETU’s size; a default diploma offer to Class 12 passers | Hiring, portable scholarships, a trade inside the degree | Delivery record; and a default offer is streaming |
| “The public middle”, “the queue”, “credential”, “demand-side subsidies”, “establishment” | Plain words, and every number with the group it is a share of | Nobody outside this argument uses those terms |
| Titled The Starved Middle, then A trade inside the degree | The lost middle | The people, not an abstraction |
| Headline figure quoted for men | Quoted for everyone aged 25 to 34: 79% have no regular salaried job | Anchoring on men hides the largest group of all, the women who never reach a job; §1 keeps the two situations apart instead |
| Karnataka’s 50% faculty vacancy in the summary | Moved to §4 and labelled as one state, one news report, read from a search excerpt | It is a single-source figure carrying weight in a headline paragraph; the sourced claim is that no scheme of any size targets underperforming government engineering colleges |
| “Prices rose by roughly 35 to 40%”, unsourced | 39% between 2018-19 and the 2025 survey, from the Economic Survey’s own table | The series was finally opened. 37.9% to 2024-25, 39.3% to mid-2025, with calendar 2025 linked from the new 2024=100 base [11] |
| “The trained school-leaver is the only line that went backwards in real terms” | Three of the five lines lost ground; the trained school-leaver lost most, at about 10% | Against a measured 39% the general degree and the polytechnic also fall, by about 4% each. The original sentence was wrong, and the corrected one is worse for the ITI case, not better |
| “The national technical-education regulator is 64% short of its own staff” | Withdrawn; replaced by 34% of sanctioned faculty posts vacant across the central institutions, 14,042 of 41,351 | A pass through the parliamentary record could not verify the regulator figure, and found the institutional one instead. UGC and AICTE share one budget line, so the regulator is not broken out [49] |
| The survey records a diploma holder’s schooling as the diploma “for 82% of them” | Not one diploma holder in the data carries a Class 10 or Class 12 code at all | gedu_lvl holds the highest general level and ranks the diploma above higher secondary, so the entry route is erased at coding time rather than partly missing [72] |
| ITI entrants described from our survey proxy alone | The government’s own tracer study: 54.3% had finished Class 12 before joining, 35.9% Class 10, 7.2% a graduate | Administrative data beats a proxy. It confirms the direction and cuts the graduate share from our proxy’s 34% to 7%, because the proxy counts full-time courses of every kind, not ITIs alone [14] |
| “A state tracer in Uttar Pradesh found 30% placed” | 8.7% employed and 0.6% in an apprenticeship, against 68.4% unemployed | The 30.5% is not in the document. The likeliest origin is 30.3%, the share of private-project graduates who did not look for a job, or 30.77%, the private share of the sample. Both are the wrong quantity [42] |
| “The national dashboard showed 0.09% placement” | Withdrawn entirely | It counts placements recorded on a dashboard, which the report’s own footnotes 11 and 12 say is not updated, and the same report’s field visits found 20 to 80%. A country whose best state places 3.2% is describing a data-entry rate [36] |
| ₹1.32 lakh per ITI student, quoted as a national unit cost | Rescoped: per student per year, 20 government institutes in Delhi and Faridabad, 2020-21 | And it is high mainly because 60% of the seats in that sample were empty, so it measures utilisation rather than the cost of teaching [36] |
| “₹15,533 crore for technical education in 2020-21, 16.0% of the education budget” | Neither number is in the document. Replaced by: technical education is 14.0% of central and 2.6% of state education-department spending | The publication imputes whole ministries, Health and MSME and Atomic Energy among them, into its all-departments technical total, which is why that total is nine times the education-department one. The original figure was most likely a casualty of that [63] |
| “PM-SETU pays against verified employment results rather than buildings”, cited to a World Bank appraisal document | It is a Program-for-Results disbursing against independently verified indicators, and whether any indicator is an employment outcome is stated as unknown | The cited URL resolves to the Rajasthan Highway Modernization Project, a different operation. The instrument-level claim survives; the employment specific does not [45] |
| “STRIVE spent ₹712 crore of ₹2,200 crore” | It spent 99% of the budget it was cut to and 30% of the budget it was appraised against, and the Centre paid 1.99% of the counterpart funding it pledged | A real numerator against the wrong denominator. ₹711.65 crore is 92% of what was released, and the story is cancellation rather than underspending [41] |
| “Reserved posts are the one part of the labour market where the caste discount does not operate”, on a measured 34% | The sectoral framing is withdrawn; the 34% is reported as what it is, a district-level erosion for post-2004 cohorts | The source compares high-expansion districts with low-expansion ones and never compares public with private hiring, so it cannot carry that claim. Its own headline is that the return to a degree stays large [57] |
| “300 to over 1,000 applicants a vacancy”, attributed to Azim Premji University | Replaced by two figures from an identified paper: in 2013 more than one in four recent Tamil Nadu graduates sat one of these exams, and 100,000 in that state were unemployed and studying full time | No source for the range could be located in two passes [56] |
| Self-employment mentioned only as a residual category | A section of its own: 8.3 crore working alone, half of it farming at ₹9,500, the paying corners under 5% | It is a larger destination than regular salaried work and the paper had nothing to say about what it is or what it pays [8,10] |
| “51% of ITI pass-outs available for work have no job”, source unread | Same figure, now with its denominator: 51% of the 85% who are economically active, which is 43.5% of all pass-outs | The word “available” was carrying the whole sentence and is now verified as load-bearing. The study also covers government ITIs only, 95% of its sample, and is unweighted [14] |
| “The women’s hostels were never built” under the polytechnic scheme | Of 499 women’s hostels, 351 were built; 105 of 500 upgrades and 159 of 295 new polytechnics stand | The committee’s own paragraph, read in the Tenth Report rather than a news summary of it: the hostels are the component that came closest to target. The “2008” the paper attached to the scheme is not in the report and is dropped [64] |
| “Three in five want a government job”, 2023 | 65% in 2016 and 55% in 2021, both read in the survey reports | The URL cited for 2023 resolves to Lokniti’s Social and Political Barometer, an electoral survey with no job-preference question. The 2023 youth study’s report could not be obtained, so its number is not used [24] |
| “Only 64% of one recent intake graduated” | 64% is the average across the eight large states in the regulator’s table, 36% in Kerala to 85% in Maharashtra, for the 2018-19 intake | Not a national figure; the article says so and the paper did not [19] |
| “Earlier schemes put 58% of their money into civil works”, cited to an Azim Premji University paper | 57.9% civil works and 31.3% equipment of the ₹20.77 crore the Model ITI scheme had spent by 31 December 2017, against a scheme guideline of 25% and 50% | The figure is not in the cited paper. NCAER’s report was found and opened: it is one scheme’s mid-term review, and its point is the inversion of the guideline, which is sharper than the bare 58% [46] |
| Karnataka’s 50% faculty vacancy, “source not stated”, body paywalled | 307 of 646 sanctioned teaching posts vacant across 16 government engineering colleges, 48%, from the state technical-education department’s annual report; no recruitment since 2010; 1,023 of 1,150 non-teaching posts also vacant | The paywall is on the canonical URL only; the same paper’s AMP copy is open and names the source and the base. The paper had labelled the figure unverifiable for three drafts [50] |
| The eight recommendations costed at ~₹12 lakh a teaching post and ~₹15 crore for a 200-bed hostel, both marked (verify) | ~₹13 lakh a post, computed from the AICTE diploma pay regulations and the January 2026 dearness allowance; ~₹6 crore a hostel, on the government’s own ₹3.00 lakh per-seat construction norm | Both were recollection. They are wrong in opposite directions and nearly cancel, so the total stands, but the hostel line was 2.5 times the government’s own norm and more than it budgets to build a whole new polytechnic [34] |
| “Government exams close around 30 to 32” | 27, 30 or 32 depending on the post, plus 3 years for OBC and 5 for SC and ST candidates | Read in the Staff Selection Commission’s own 2026 notices rather than recalled [59] |
| Industry testimony on what each qualification earns at entry and ten years on | Measured instead: polytechnic diploma ₹18,000 → ₹28,000, engineering degree ₹35,000 → ₹55,000, general graduate ₹18,000 → ₹28,000 | We can measure this and did not need a persona for it. It also shows something the testimony missed, that the diploma and the general degree start and finish level [39] |
| State technical-education budgets “85 to 90% salaries and pensions”, guest lecturers at “₹25,000 a month” | The proportions are withdrawn from the text; the mechanism stays, sourced to Karnataka’s vacancy record | A pass looking for documents found none. What is documented is cited separately and does not establish the salary share [32] |
| Appendix A: “Everything else was read through a search engine, because the research runs could not open web pages” | 25 outside sources downloaded, read and archived with a hash each; a reference marked Opened was read in the document | The sentence was true of the research runs and stopped being true in September. Left standing it would have told a reader the paper rests on excerpts, which is now the opposite of the case |
| “The polytechnic’s profile has moved from 49% to 59% at 35 to 40” | Same figure, now carrying its sample: 45 women | Direction, not magnitude. The engineering degree’s -5.6 at the same ages rests on 28 [54] |
| The drift in the age profiles listed as unexplained | The composition explanation is ruled out: the sex mix of both routes moved, in opposite directions, and accounts for at most 2 points of drifts as large as 10. What remains is within-sex, and for the general degree it is mid-career, not entry | The obvious mechanical story was the one the paper had already used elsewhere, so it needed testing rather than assuming. It fails [54] |
| “0.8 to 1.6 lakh a year” lateral transfers, from the quota | Unchanged, but bounded: that is 26 to 52% of all diploma passouts in 2021-22, so it is a ceiling nobody approaches. Diploma completion is 51-72%, median 62% | AICTE publishes no transfer or dropout field, so the count stays impossible; the panel bounds it. Two of its eleven years are unusable and the data exposes them itself [71] |
| Nothing on what it costs to attempt engineering or medicine | Kota, 2023: 87% of 1,002 coaching students paying a lakh or more a year, half of them on a repeat attempt, a fifth with no plan if they fail | The paper described the 3% who get in and said nothing about the price of trying. Read as the inside of that funnel, not an average aspirant [47] |
| The Lokniti 2023 citation described as “could not be verified” | Settled: the barometer was read end to end and its 33 questions are all electoral. It contains no job-preference question at all | It did not fail to verify, it pointed at a survey that never asked. Worth the distinction, because the first invites a retry and the second closes it [24] |
| Charts existed only inside the interactive page | Twelve static figures and three data tables, rendered into the Markdown from the same JSON the text uses | The page was the only surface carrying them, and it had no public home. A figure can no longer drift from the numbers beside it |
| “B.Voc died when its funding lapsed and state commissions would not recognise it” | Stalled: half the surveyed colleges received half their grant, some closed programmes, three in ten fill their seats | The cited study says nothing about recognition by commissions, and UGC’s 2016 order asks them to treat the degree at par. Enrolment grew to 33,263 by 2018-19, so “died” was wrong too [55] |
| “PMKVY 4.0 used about 14% of its budget”, cited to an April 2025 news report | Same figure, cited to the committee’s March 2026 report as covered by Careers360 | The April 2025 article does not carry it. The committee report itself could not be downloaded [65] |
| “Whether any PM-SETU indicator is an employment outcome is not established” | The appraisal document has been read: the largest of six indicators, US$277 million of US$830 million, is the employment rate of graduates, wage or self-employed, from annual tracer surveys | Report PADHP00147, filed under the operation’s new name. Recommendation 5 now asks for a pay floor on an indicator that exists rather than for an indicator [45] |