What Indian education is worth: the findings
Aggregate analysis of public government survey microdata (MoSPI PLFS). No Avanti student data and no personally identifiable information: every figure is a weighted population share, a cell count or a percentile of reported earnings.
Eight things the data says. Every number is drawn from a completed analysis — the links go to the working. Detail is in the footnotes; the bullets carry one number each.
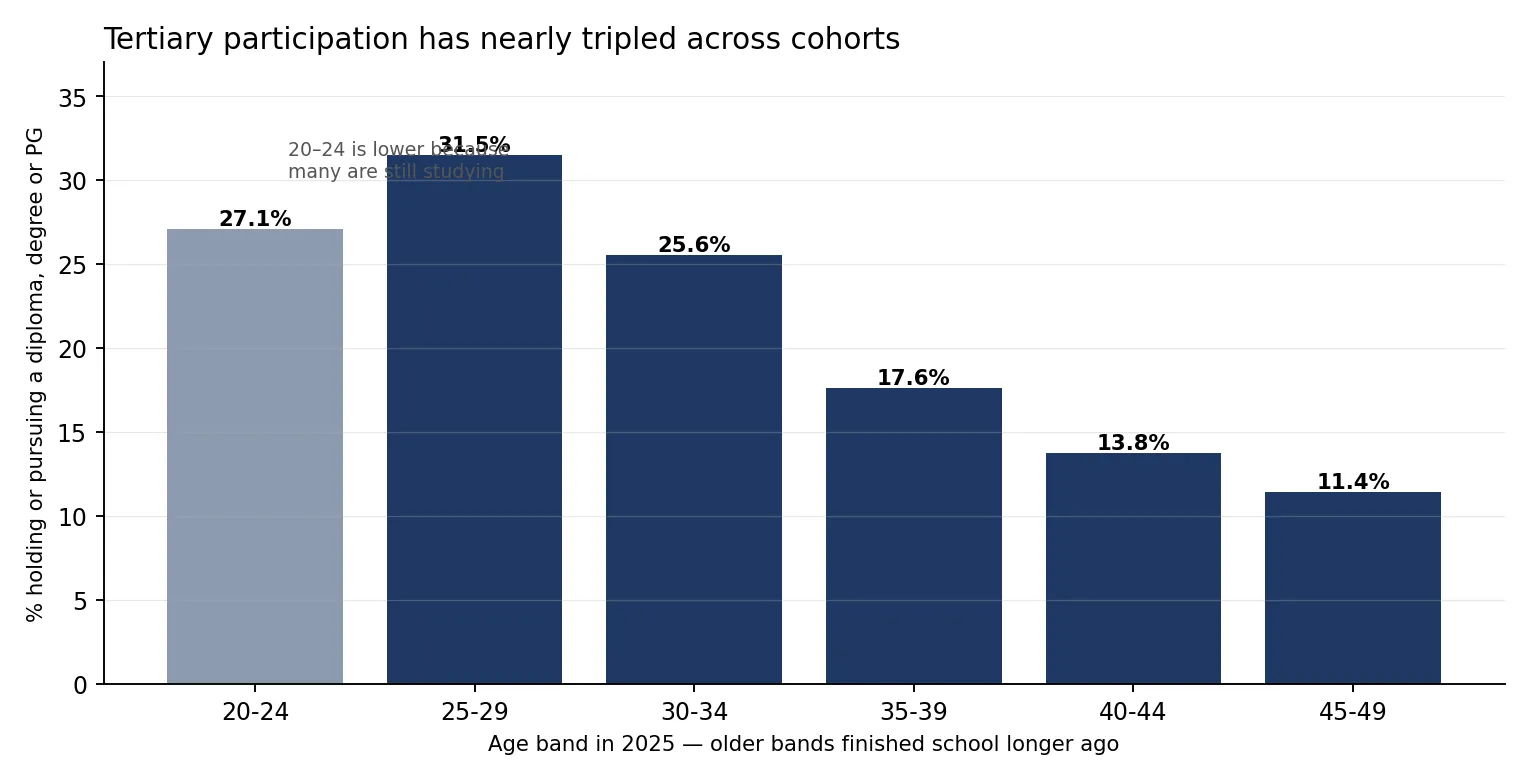
1. Nearly one in three young Indians now pursues a degree or diploma after Grade 12 — 31.5% — and that is real progress. Their parents’ generation, now in their late forties, managed 11.4%.1
2. But the qualification barely predicts whether you work. A general degree — four in five of all degrees held in India — delivers formal employment to just 7.98 million of the 49.26 million who hold one, 16.20%, and more education does not fix it: a general master’s reaches 25.57%, below a technical diploma.2
3. Engineering, medicine and technical diplomas are the exceptions, at four to seven times the employment rate of a school-leaver — engineering 52.58%, medicine 32.41%, technical diploma 30.77%, against higher secondary’s 7.38%. But they are small: 4.37 million people in formal work across all three, against 8.26 million from the school rungs alone. They are also the only qualifications with consistent wage growth.3
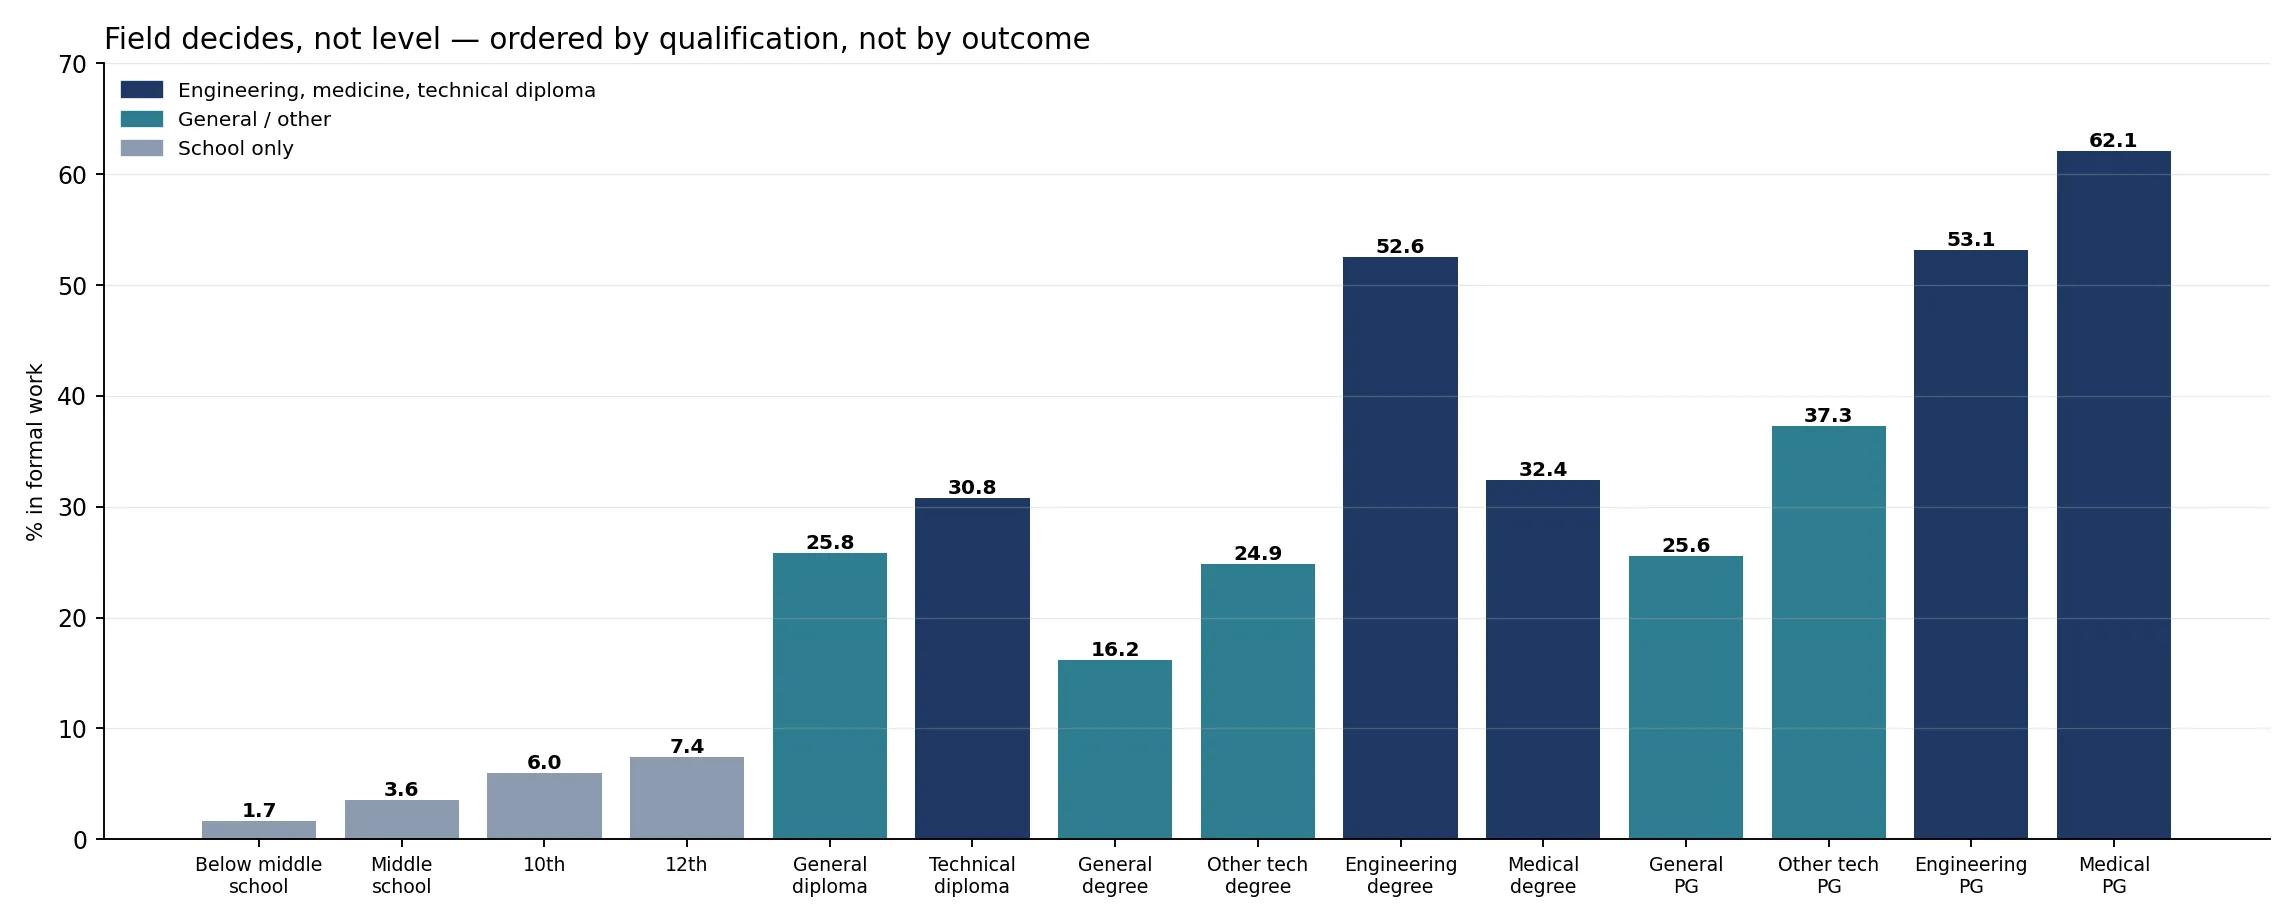
Read across the chart and the pattern is not height, it is colour. At every level — diploma, degree, postgraduate — the technical field beats the general one. A technical diploma (30.8%) beats a general degree (16.2%). A general master’s (25.6%) loses to that same diploma. And the two highest bars on the whole ladder are postgraduate medicine (62.1%) and postgraduate engineering (53.1%).4
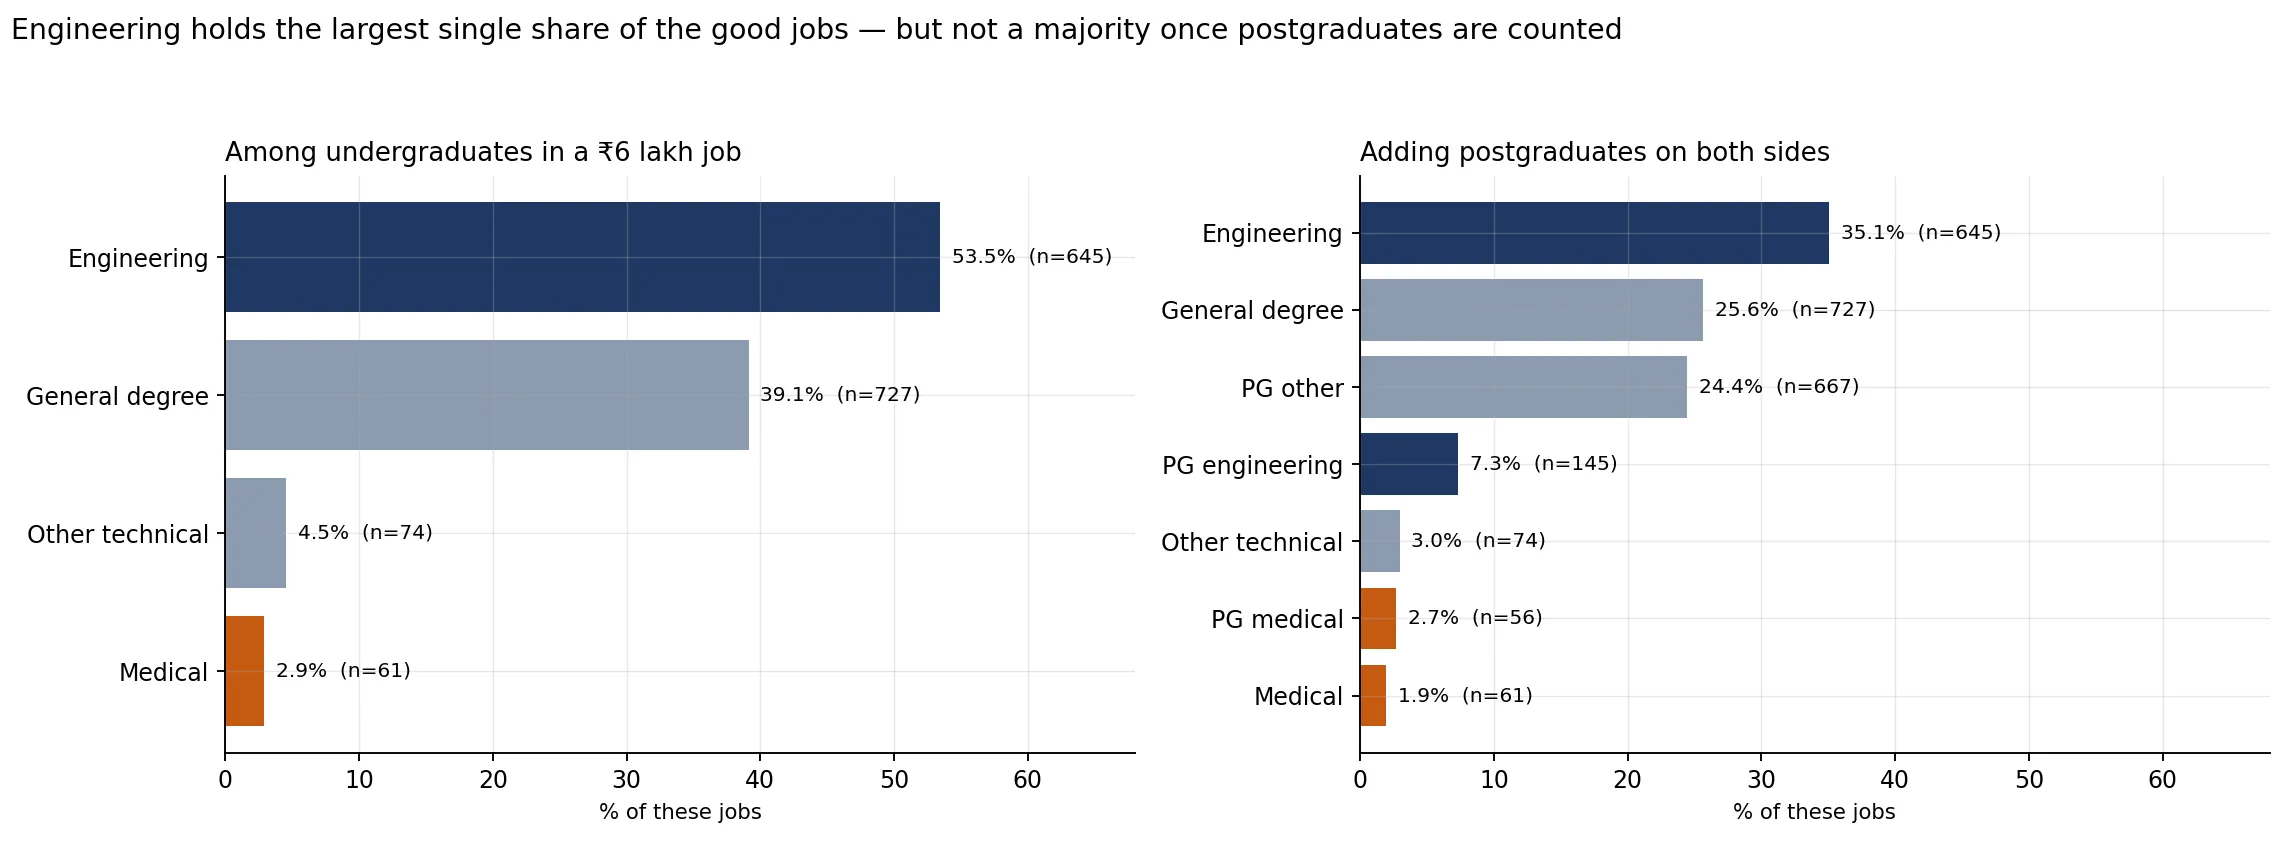
4. Aspirational jobs — above ₹6 lakh a year — go to 3.8% of young people. Among those with an undergraduate degree who hold one, 53.5% are engineering graduates.5
4a. And whatever the degree says, the job is software. 51.6% of employed engineering graduates do software work — 1.47 million people — against 21.3% doing engineering, science or technical work. Medicine is the only field whose degree names its destination: 76.1% work in health.6
5. Even counting postgraduates, 42.4% of these jobs are held by someone with an engineering degree — undergraduate or postgraduate.7
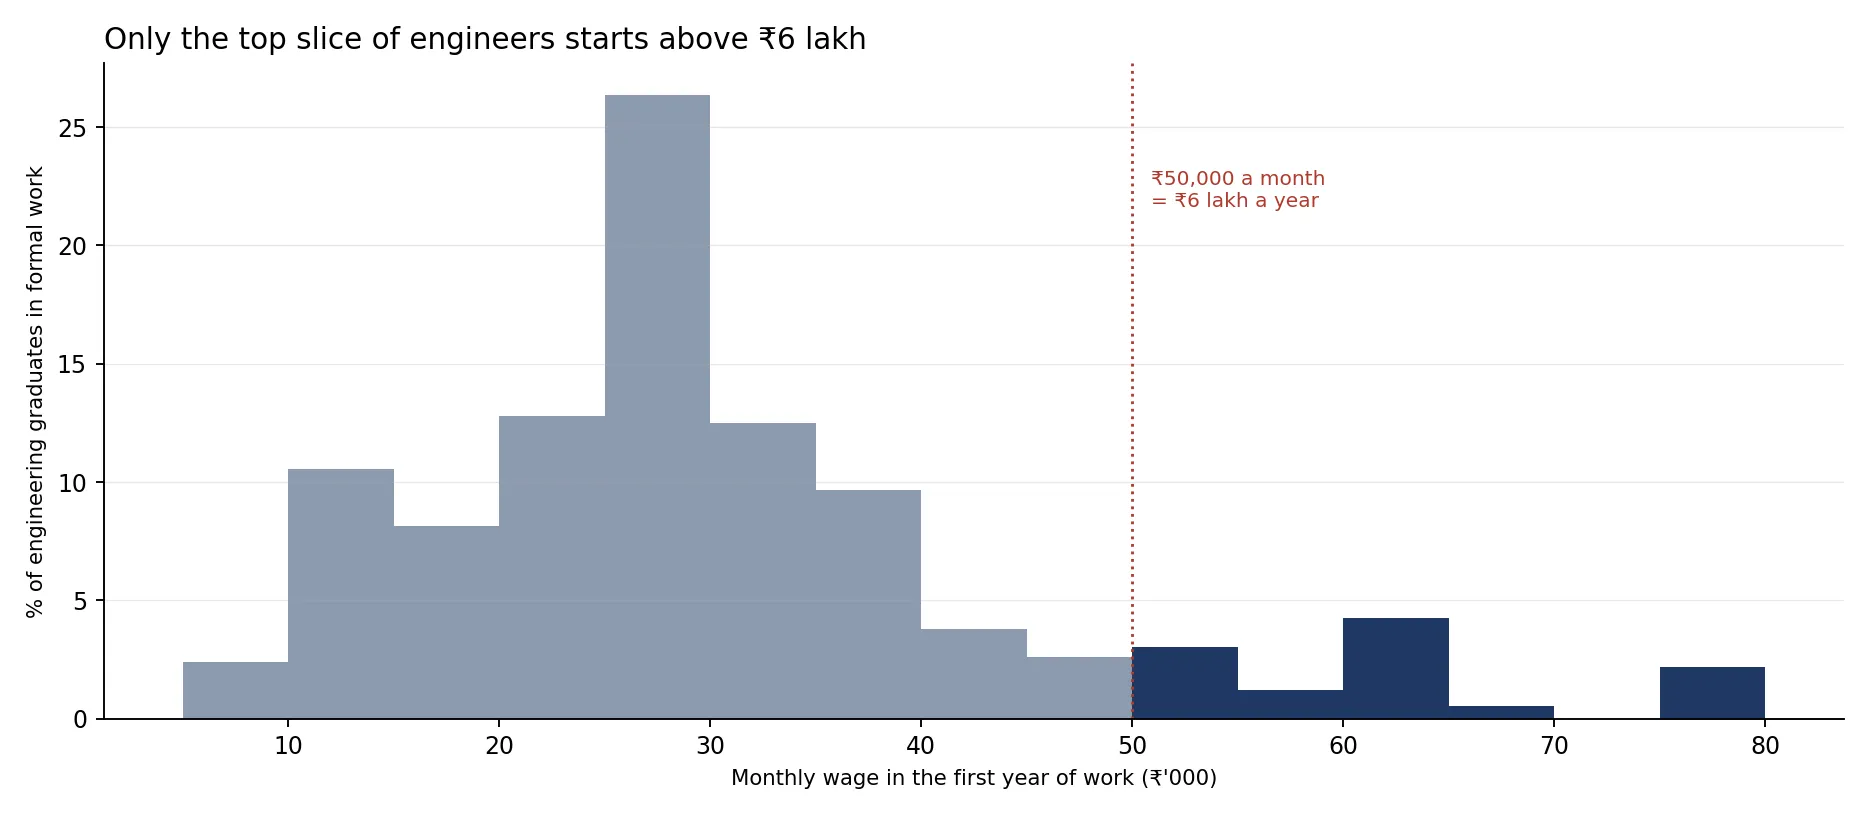
6. And even among engineers, only the top 11.2% reach one at entry. So the demand that drives the whole system is really demand for the top slice of engineering seats.8
7. Which is why the seats are emptying: 34.1% of approved engineering degree seats go vacant, and capacity has already been cut by a quarter from its peak.9
8. Technical diplomas are the one qualification that works and is under-enrolled — 49.4% of their seats sit empty, and vacancy there has risen while engineering’s fell.10
Footnotes
Section titled “Footnotes”Figures are generated from the extract CSVs by
build_charts.py, so no chart can drift from the analysis
behind it. Every number in this document is re-checked against those CSVs by
check_findings.py, which exits non-zero on any mismatch — run it after
rebuilding any of the three analyses.
Numbers from three completed analyses: PLFS education ladder (fourteen qualification rungs, 263,446 people surveyed), PLFS graduate earnings (six graduate buckets, wage growth by tenure), and AICTE/AISHE seat capacity (seats approved and filled, 2012-13 to 2021-22). Each carries its own method, assumptions and limitations; the ladder additionally carries a register of seven claims it has retracted.
Every population count here is a lower bound. PLFS weights sum to the survey’s own Census-2011-anchored projection — 1,193m against India’s actual ~1,450m — so headcounts are understated. Three independent anchors put the correction at 1.17×–1.32×, and it is not uniform by age, so no single scalar is applied and none should be read in. No share, rate or comparison in this document is affected — numerator and denominator carry the same deflation. See ASSUMPTIONS.md A4.
Nothing here is causal. People who choose engineering differ from people who choose a B.A. in ways none of this data can see. Every comparison describes what two groups look like, not what the qualification did to them.
Footnotes
Section titled “Footnotes”-
PLFS CY2025. Share holding or pursuing a diploma, degree or postgraduate qualification, by five-year age band: 31.5% at 25–29, 25.6% at 30–34, 17.6% at 35–39, 13.8% at 40–44, 11.4% at 45–49. The 20–24 band reads lower (27.1%) because much of it is still studying, which is why 25–29 is the figure quoted. AISHE independently shows total higher-education enrolment rising from 30.15m to 45.00m between 2012-13 and 2023-24, a 1.49× increase still rising in the latest year. Sources: education ladder, seat capacity. This is a synthetic cohort, not a panel — each band is a different set of people, not the same people followed over time. ↩
-
Rung 10, general degree — 49.26m people, 85% of everyone holding a bachelor’s degree, at 16.20% formal employment. Higher secondary is 7.38%, so a degree roughly doubles the odds and leaves five in six without formal work. Rung 11, general postgraduate is 25.57% against the technical diploma’s 30.77% — so two further years of general study end below a diploma obtained six or seven years earlier. See footnote 4: this only became visible once postgraduates were split by field. On prestige specifically: this data cannot see institutional prestige. That question is the subject of a separate NIRF analysis, not yet merged. ↩
-
Ratios against higher secondary (7.38%): engineering 7.1×, medicine 4.4×, technical diploma 4.2×. Wage growth over the first three-plus years in work: engineering 1.68×, technical diploma 1.34×, medicine 1.40× — against 1.14–1.17× for every school rung, where the median barely moves. Engineering · medicine · technical diploma. Caveat: “medicine” here is the health workforce broadly — a quarter of it is doctors, nearly a third nursing roles. ↩
-
Postgraduates were a single rung until this split and read 29.11%, which was a composition artefact: PG general is 83% of the rung at 25.57%, while PG engineering reaches 53.13% and PG medical 62.12%. Caveat: PG medical rests on 195 people and PG engineering on 709 — the employment rates are worth quoting with those sample sizes attached, the wage tables are not. Correction recorded: when these rungs were first split they inherited a single entry window of 23–25. That is right for a general master’s and wrong for medicine, where an MD is three years after MBBS — only 2.6% of that rung is even aged 21–23. On the corrected 27–29 window, PG medical’s employment at entry is 70.90%, not the 32.42% first published. The figures quoted above are whole-population rates and were unaffected. ↩
-
3.8% of all undergraduate degree holders aged 21–34 are in formal work paying ≥₹50,000 a month. Among UG degree holders who hold such a job, 53.5% hold an engineering degree (n=645 of 1,507). Source: education ladder. ↩
-
Job function is a committed NCO 2015 map — fifteen functions over all 128 three-digit groups PLFS emits, each mapped exactly once, authored in
build_job_function.py. NCO orders occupations by skill level before function, so software work is split across 251/252 (professionals), 351/352 (technicians) and 133 (managers); rolling it up is what makes the 51.6% visible at all. Function is not the same axis as field of study — 80 general-degree holders work as engineering professionals — and it is not sector: public/private stays separate, onetyp_pas. Per-rung tables are in each rung note. ↩ -
Adding postgraduates to both sides: 42.4% of everyone with a degree in a ≥₹6 lakh job holds an engineering qualification, undergraduate or postgraduate (n=790 of 2,375). The share falls because postgraduates hold a large block of these jobs and most of them have no technical degree. ↩
-
11.2% of engineering graduates in their first year of formal work clear ₹6 lakh; 17.6% across ages 21–34 as wages rise with tenure. See ENGINEERING.md. This is a measurement; the inference from it — that demand concentrates on the top ~15% of engineering seats — is an inference, not something this data establishes. ↩
-
AICTE, 2021-22: 34.1% of approved UG engineering seats had no student in them. Approved intake has fallen from a 2014-15 peak of 17.05 lakh to 12.53 lakh, −26.5%, every year since. Source: seat capacity. Caveat: vacancy is measured, not explained — it could be falling demand, closures, or rising entry thresholds. AICTE 2022-23 is excluded as an incomplete data load. ↩
-
AICTE, 2021-22: 49.4% of approved engineering-diploma seats vacant, up from 32.2% in 2012-13 — the opposite direction to UG engineering over the same period. The stock of technical-diploma holders is 4.06m against 49.26m general-degree holders, twelve times fewer, for a qualification with nearly double the formal-employment rate. ↩