Executive Summary
Aggregate analysis of public government survey microdata (MoSPI PLFS). No Avanti student data and no personally identifiable information: every table is a weighted population share or a cell count, and the replication extracts are cell-level aggregates.
India has expanded tertiary education faster than it has expanded the returns to it. Among 24 to 28 year-olds in the 2025 Periodic Labour Force Survey, a general graduate degree barely improves the odds of holding a regular salaried job. The qualifications that do improve those odds are held by very few people, and almost none of them are poor.
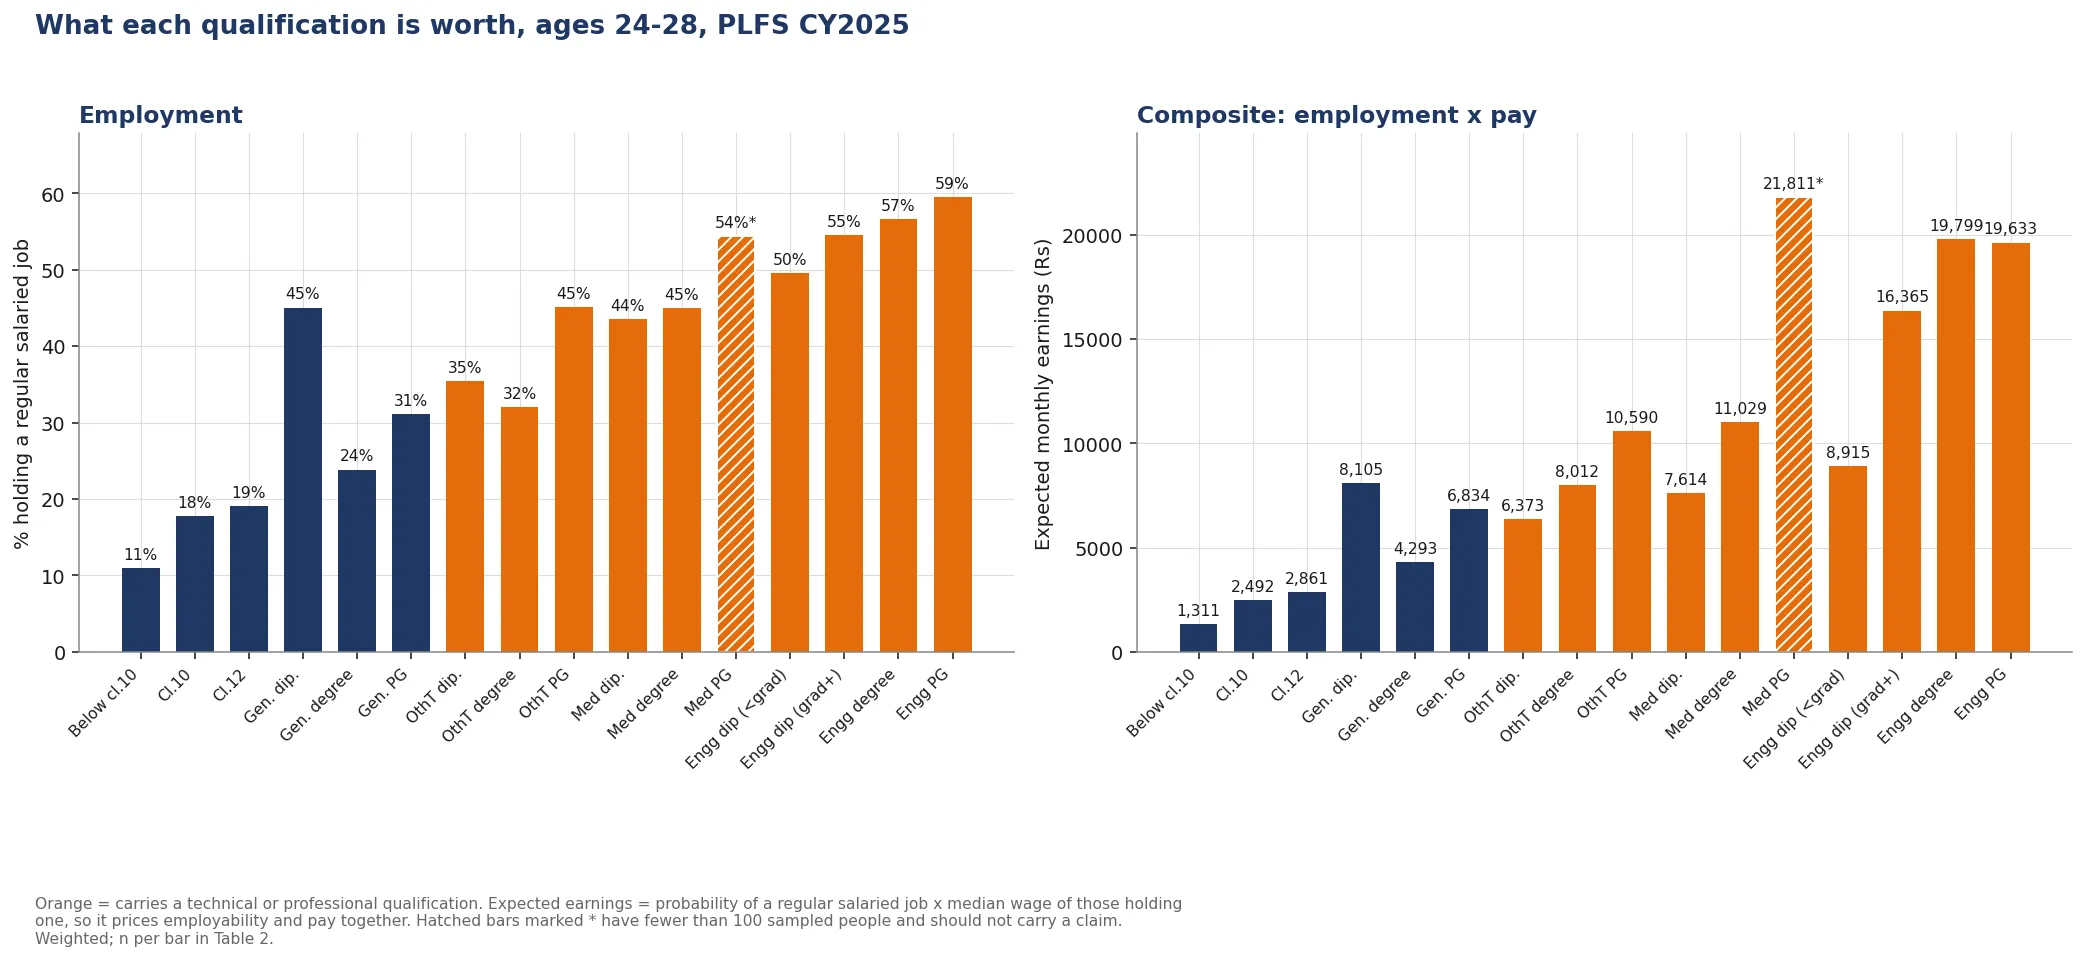
A plain bachelor’s degree is associated with a regular-salaried rate of 23.9%, against 19.1% for someone who stopped at class 12, and median pay of ₹18,000 a month against ₹15,000. Pricing employment and pay together it is worth about 1.5 times a class-12 education. That is the weakest return of any qualification past class 12, and 18% of the age band holds it, more than twice every technical pathway combined.
Everything else past class 12 does better. A below-graduate engineering diploma is worth 3.1 times class 12, a general postgraduate degree 2.4 times, an engineering degree 6.9 times. The composite spread across tertiary routes is wider than the spread between class 10 and a bachelor’s degree.
How a pathway earns its return matters, and the routes differ. A below-graduate engineering diploma is almost pure employment gain: 2.6 times class 12 on getting a regular salaried job and only 1.2 times on pay, the same pay multiple as a bachelor’s degree. It works by getting its holder hired. An engineering degree does both, and over a career its advantage shifts from employment to pay, so the gap between the diploma and the degree widens with age rather than closing.
The dividing line inside the technical routes is the graduate level, not diploma against degree. A graduate-level engineering diploma pays ₹30,000 and a degree ₹35,000; a below-graduate engineering diploma pays ₹18,000, the same as a general bachelor’s degree.
These pathways are small. 31.9% of the age band holds a tertiary qualification and only 9.1% holds a technical one, so about seven in ten Indian tertiary qualifications carry no technical component. Fewer young people hold a technical qualification than stopped at class 10.
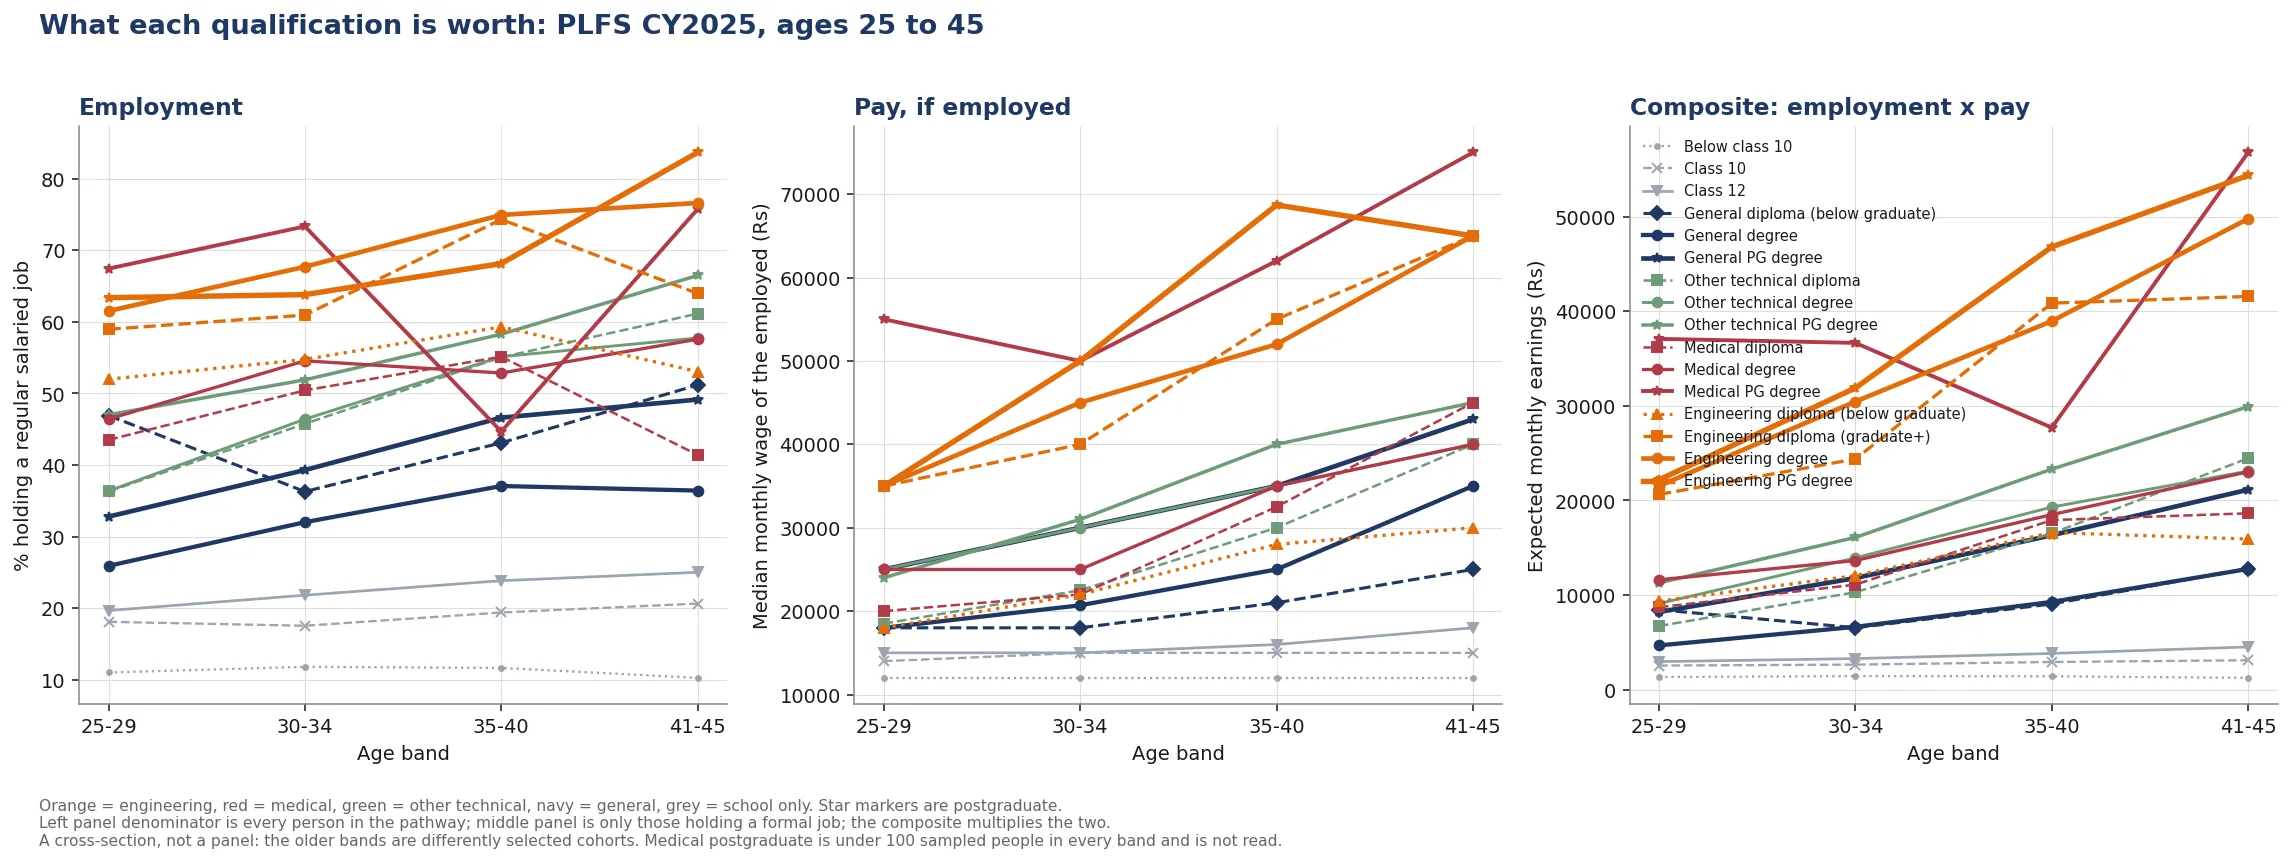
School alone does not compound. Someone who stopped before class 10 has a median wage of ₹12,000 at ages 25 to 29 and ₹12,000 at 41 to 45, and their employment rate falls over those twenty years, so the composite declines. Class 12 moves from ₹15,000 to ₹18,000. Every tertiary pathway rises, and the technical ones rise fastest.
The age comparisons come from different age groups at one moment rather than from following people, and older holders of the rarer qualifications are a more selected group, so these slopes are flattered. Age bands stop at 41 to 45 for that reason: beyond it the cells thin out on exactly the pathways of interest.
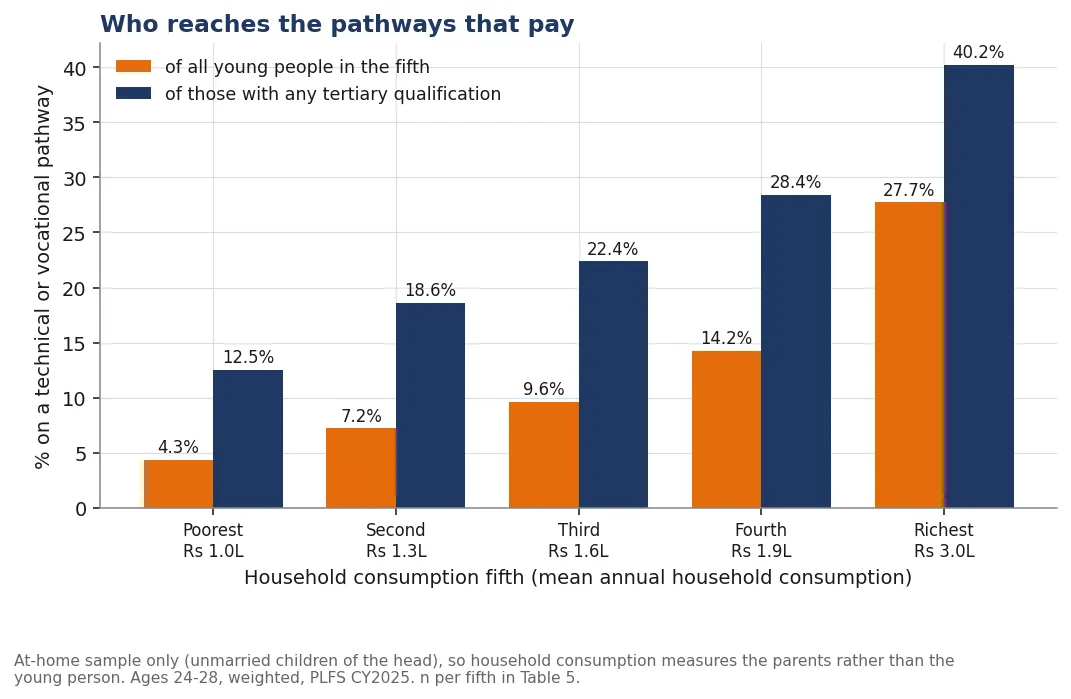
Access to the pathways that pay is where the inequity concentrates. Among young people still living with their parents, so that household spending measures the parents rather than the young person, 4.3% of the poorest fifth hold a technical qualification against 27.7% of the top fifth, about six times. The poorest fifth here is a household consuming about ₹1.0 lakh a year and the top fifth about ₹3.0 lakh. The narrower comparison is more useful: among those who reach any tertiary education, 12.5% of the poorest fifth hold a technical qualification against 40.2% of the top fifth, about 3.2 times. Getting a poor student into college is not the same as getting them onto the pathway that pays, and the second gap is the one this data locates.
One clarification about the words rich and poor, which matter here. The top fifth in this data is a household spending about ₹3.0 lakh a year with under four members. That is not affluent. The bottom fifth spends about ₹1.0 lakh. The genuinely well-off are a sliver inside the top fifth and cannot be identified in this survey, so every gap reported here understates the distance to India’s professional class.
How sure are we. This is a descriptive analysis of a government household survey, so these are associations and not effects. Someone who obtains an engineering qualification differs from someone who does not in ways the survey never records, and part of the measured return belongs to those differences rather than to the qualification. The intervals come from resampling the survey’s own sampling units, which its clustered design requires, and the main results rest on tens of thousands of observations. The binding limitation is that PLFS records no institution and no field of study. It cannot tell an engineering degree from a top-ranked college apart from one from a tier-four private college, and that distinction is very likely where much of the remaining gap sits. Testing it needs NIRF rankings, admission cutoffs and alumni outcomes, and is the natural next step.
Credentials Without Returns: tertiary education, employment and pay in India, and who reaches the pathways that pay
Section titled “Credentials Without Returns: tertiary education, employment and pay in India, and who reaches the pathways that pay”Outcome definition. Throughout this paper, the employment outcome is regular salaried work (
pas='31'in PLFS): a salaried job, whether or not it carries a written contract or any social security. It is the conventional labour-economics measure and the one every rate below is computed on.The companion ladder analysis reports a stricter measure it calls formal, being regular salaried AND actually paid AND (written contract OR social security), which runs roughly eight points lower on the same population. The gap between the two is the informal salaried workforce. Both are emitted by the shared extract; this paper uses the looser one, and says so wherever a rate appears.
Abstract
Section titled “Abstract”We use Periodic Labour Force Survey microdata for calendar 2025 to measure the labour-market return to each tertiary pathway in India, and to ask who reaches the pathways that pay. Classifying qualifications by field, level and degree-against-diploma into sixteen buckets, a plain bachelor’s degree with no technical component is associated with a regular-salaried rate of 23.9% against 19.1% at class 12 (ratio 1.32, 95% CI 1.24 to 1.40) and median monthly pay of ₹18,000 against ₹15,000. Pricing employment and pay together as expected earnings it is worth 1.50 times class 12, the weakest return of any qualification past class 12, and it is held by 18.0% of the age band. A below-graduate engineering diploma is worth 3.12 times class 12, a general postgraduate degree 2.39, an engineering degree 6.92. Decomposed, the below-graduate engineering diploma is almost entirely an employment effect (2.64 times class 12 on holding a regular salaried job, 1.20 on pay), while the engineering degree gains on both and its advantage shifts from employment toward pay between ages 25 and 45. The dividing line inside the technical routes is the graduate level rather than diploma against degree. Only 9.1% of the age band holds any technical qualification. Restricting to young people co-resident with parents so that household consumption measures origin, 4.3% of the poorest consumption fifth (mean household consumption ₹1.01 lakh a year) hold a technical qualification against 27.7% of the top fifth (₹3.04 lakh); conditional on reaching any tertiary education the shares are 12.5% and 40.2%. All intervals are cluster bootstraps over first-stage sampling units. These are associations. No causal claim is made.
1. Introduction
Section titled “1. Introduction”India’s gross enrolment ratio in higher education has roughly doubled since the mid-2000s. The question this paper asks is narrow and empirical: what does the resulting qualification do for a young person in the labour market, and does the answer depend on which qualification it is.
The answer in this data is that it depends almost entirely on which qualification it is. A general graduate degree, which is what roughly three quarters of Indian tertiary education produces, is associated with a six percentage point improvement in the chance of holding a regular salaried job over class 12, and about ₹3,000 a month more for those who find one. A technical or vocational qualification is associated with two to three times that improvement. The distance between a general degree and an engineering qualification is larger than the distance between class 10 and a general degree.
This matters for Avanti Fellows, whose programmes move low-income students toward selective engineering and medical institutions. The pathway-level results are consistent with that focus. They also locate a second problem the organisation does not currently measure: among poor students who do reach tertiary education, about one in ten reaches a technical or vocational pathway, against nearly four in ten among the better-off. Expanding college access and expanding access to the pathways that pay are different problems.
Three contributions. First, we price each pathway on employment and pay jointly rather than separately, which changes the ranking: a diploma looks worse than a general degree on pay alone and better once employability is included. Second, we report the age-earnings curve by pathway, which shows the general degree’s return is a slope rather than a level. Third, we measure access to the paying pathways under a co-residence restriction that keeps the origin measure clean, and split the access gap into reaching tertiary education at all and reaching the part of it that pays.
We also state what this data cannot do. PLFS records no institution and no field of study, so the hypothesis that most of the remaining variation is institutional quality is one this paper motivates and cannot test. Section 9 sets out what would.
2. Setting: what PLFS is and what it can measure
Section titled “2. Setting: what PLFS is and what it can measure”PLFS is India’s official labour-force survey, run by the National Statistics Office, and the source for the national unemployment rate. Field staff visit sampled households and enumerate every member.
Four properties determine what this paper can ask.
It is a stratified multi-stage cluster sample, not an independent draw. Calendar 2025 covers 36 states and union territories, 764 districts, 22,594 first-stage units (a village or an urban block), 270,472 households and 1,148,634 persons. Households are drawn within selected first-stage units, so respondents are not independent. Every interval here resamples those units rather than persons. The measured design effect on estimates of this kind is 3.5 to 4.7, so the standard error is roughly twice what an independence assumption gives.
It records qualifications, not institutions. One variable gives the highest general education level completed. A second gives any technical or professional qualification. Nothing identifies the college, its selectivity, or the field of study beyond broad categories. An IIT degree and a tier-four private engineering degree take the same value.
Its earnings variable covers regular salaried work well and other work poorly. Monthly earnings are recorded for regular salaried activity. Most Indian workers are self-employed or in casual work, so the pay results here describe regular salaried employment, which is 22.4% of this age band.
It measures consumption, not income. PLFS collects household expenditure in an abbreviated block of five components, where the dedicated Household Consumption Expenditure Survey collects an item-level schedule. Monthly per-capita consumption is the standard way to rank Indian households and is what we use. It is a coarse relative ranking rather than an income measure, and section 8 states the consequences.
3. Data
Section titled “3. Data”3.1 Source and linkage
Section titled “3.1 Source and linkage”| Table | Grain | Rows | Use here |
|---|---|---|---|
plfs_fact_persons |
person x release x visit | 8.44M | age, sex, education, technical qualification, activity status, earnings |
plfs_fact_households |
household x release x visit | 2.08M | consumption, household size, sector, social group |
Both in avantifellows.external_data_sources in BigQuery. All results use calendar 2025.
Persons and households join on (hh_id, seg, release_id). The household id is not unique within a
release on its own: it collides for about 23,000 households on ten of the eleven loaded releases because it
omits the segment field, and the colliding rows are different households with different consumption. Joining
without the segment gives a one-to-many join that inflates person rows by about 45%. Calendar 2025 is the
one release where the id happens to be unique, so a single-release analysis is unaffected and a multi-release
one is not. Section 11 records this.
3.2 Sample construction and definitions
Section titled “3.2 Sample construction and definitions”Every query restricts to first visits. Activity status is collected only at the first visit, 100% populated there and 0% at revisits, and the annual releases carry four visits, so an unfiltered query would lose the variable and count households up to four times.
All population figures use the survey’s calibrated annual weight. Raw row counts are reported as sample sizes and never as population numbers.
The pathway variable is the highest qualification held, made mutually exclusive, with a technical qualification taking precedence over the general level it sits on:
| Pathway | Definition (technical code, then general level) |
|---|---|
| Below class 10 | no technical qualification, general education below secondary |
| Class 10 | no technical qualification, secondary completed |
| Class 12 | no technical qualification, higher secondary completed |
| General diploma (below graduate) | no technical qualification, general diploma or certificate |
| General degree | no technical qualification, graduate |
| General PG degree | no technical qualification, postgraduate |
| Other technical diploma | technical diploma, any level, in agriculture, crafts or other subjects |
| Other technical degree | technical degree in agriculture, crafts or other subjects, graduate |
| Other technical PG degree | the same, postgraduate |
| Medical diploma | technical diploma, any level, in medicine |
| Medical degree | technical degree in medicine, graduate |
| Medical PG degree | technical degree in medicine, postgraduate |
| Engineering diploma (below graduate) | technical diploma below graduate, engineering or technology |
| Engineering diploma (graduate+) | technical diploma at graduate level or above, engineering or technology |
| Engineering degree | technical degree in engineering or technology, graduate |
| Engineering PG degree | the same, postgraduate |
Three notes on the construction, because it is the part most easily got wrong.
The technical variable crosses three levels with five fields. Its sixteen codes are a technical degree (codes 02 to 06), a diploma below graduate level (07 to 11), or a diploma at graduate level or above (12 to 16), each in agriculture, engineering, medicine, crafts or other subjects. An earlier version of this analysis mapped only eight of those codes and so missed every below-graduate technical diploma, 3,412 people in this age band, who were then classified by their general education instead. That put below-graduate engineering diploma holders into a bucket labelled “diploma or certificate” alongside general diplomas, and made that bucket look like a strong non-technical pathway when most of it was technical.
Graduate against postgraduate is not in the technical variable and is obtained by crossing it with general education: a technical degree holder recorded as postgraduate is a postgraduate in that field. Every technical degree holder is recorded as graduate or postgraduate with no leakage to lower general levels, so the cross partitions cleanly.
There is no graduate-level non-technical diploma. A diploma recorded in general education sits below graduate by construction, and any graduate-level diploma is recorded in the technical variable and is therefore technical. That cell does not exist rather than being empty.
A technical qualification always takes precedence over the general level it sits on, because the question is what the technical layer adds.
“Formal job” means regular salaried or wage employment. “Wage” means monthly earnings in that activity, conditional on holding it and on positive pay. Earnings are gated on activity status rather than on the earnings field being non-null, because that field is zero-filled and positive on only 10 to 17% of rows.
“Paying pathway” means the four technical and vocational rows above, grouped together. The grouping is defined before the results are seen: it is every tertiary route other than the general degree.
3.3 Samples ledger
Section titled “3.3 Samples ledger”| Sample | Restriction | n | Used for |
|---|---|---|---|
| Age band, full | ages 24-28, first visit, weighted | 106,104 | sections 4, 5, 7.1 |
| Age panel, all persons | ages 25-45, first visit | 380,024 | section 6, employment |
| Age panel, earners | ages 25-45, regular salaried, positive pay | 76,622 | section 6, pay and composite |
| At-home sample | ages 24-28, unmarried child of head | 36,238 | sections 7.2, 7.3 |
| At-home, poorest fifth | as above, bottom consumption fifth (mean ₹1.01 lakh a year) | 4,242 | sections 7.2, 7.3 |
| At-home, top fifth | as above, top consumption fifth (mean ₹3.04 lakh a year) | 10,335 | sections 7.2, 7.3 |
Comparisons are not matched. They are weighted population shares within qualification or consumption groups, with no covariate adjustment. Section 7.2 shows what the consumption groups differ on, and section 8 states what follows.
4. What each qualification is worth
Section titled “4. What each qualification is worth”PLFS calendar 2025, ages 24 to 28, full sample, weighted. Sixteen buckets, because the returns turn out to depend on three things at once: the field, the level, and whether the qualification is a degree or a diploma.
Table 2. Employment, pay and the two combined, by highest qualification
| Pathway | % of cohort | Formal job | Median wage | 25th | 75th | Expected earnings | vs class 12 | n |
|---|---|---|---|---|---|---|---|---|
| Below class 10 | 37.9% | 10.9% | ₹12,000 | ₹9,000 | ₹15,000 | ₹1,311 | 0.46 | 30,061 |
| Class 10 | 13.1% | 17.8% | ₹14,000 | ₹10,000 | ₹17,600 | ₹2,492 | 0.87 | 16,935 |
| Class 12 | 17.1% | 19.1% | ₹15,000 | ₹10,000 | ₹18,000 | ₹2,861 | 1.00 | 21,053 |
| General diploma (below graduate) | 0.4% | 45.0% | ₹18,000 | ₹13,400 | ₹24,000 | ₹8,105 | 2.83 | 430 |
| General degree | 18.0% | 23.9% | ₹18,000 | ₹12,000 | ₹25,000 | ₹4,293 | 1.50 | 22,461 |
| General PG degree | 4.4% | 31.1% | ₹22,000 | ₹15,000 | ₹35,000 | ₹6,834 | 2.39 | 5,464 |
| Other technical diploma | 1.9% | 35.4% | ₹18,000 | ₹12,000 | ₹25,000 | ₹6,373 | 2.23 | 2,284 |
| Other technical degree | 1.0% | 32.0% | ₹25,000 | ₹15,500 | ₹30,000 | ₹8,012 | 2.80 | 1,088 |
| Other technical PG degree | 0.7% | 45.1% | ₹23,500 | ₹15,000 | ₹35,000 | ₹10,590 | 3.70 | 782 |
| Medical diploma | 0.6% | 43.5% | ₹17,500 | ₹12,000 | ₹28,000 | ₹7,614 | 2.66 | 720 |
| Medical degree | 0.4% | 45.0% | ₹24,500 | ₹15,000 | ₹35,500 | ₹11,029 | 3.85 | 465 |
| Medical PG degree* | 0.1% | 54.4% | ₹40,100 | ₹18,000 | ₹185,000 | ₹21,811 | 7.62 | 85 |
| Engineering diploma (below graduate) | 1.4% | 49.5% | ₹18,000 | ₹14,200 | ₹25,000 | ₹8,915 | 3.12 | 1,550 |
| Engineering diploma (graduate+) | 0.5% | 54.6% | ₹30,000 | ₹20,000 | ₹45,000 | ₹16,365 | 5.72 | 509 |
| Engineering degree | 2.2% | 56.6% | ₹35,000 | ₹25,000 | ₹50,000 | ₹19,799 | 6.92 | 1,962 |
| Engineering PG degree | 0.3% | 59.5% | ₹33,000 | ₹25,000 | ₹58,000 | ₹19,633 | 6.86 | 255 |
* marks a row with fewer than 100 sampled people, which should not carry a claim. PLFS’s clustered design
costs a factor of 3.5 to 4.7 on the variance, so the effective sample is roughly a quarter of the raw count
and 100 raw observations is about 25 independent ones.
Expected earnings is the probability of holding a regular salaried job multiplied by median pay conditional on holding one. It exists because employment and pay rank these pathways differently and neither alone answers what a qualification is worth to somebody about to choose it. It counts a person without a regular salaried job as earning zero, which is wrong for an individual (they may be self-employed, in casual work or studying), so it is a comparison of regular-salaried prospects and not an earnings estimate.
Read the general-degree row first, because it is the largest tertiary group by a factor of nine. A plain bachelor’s degree is associated with a regular-salaried rate of 23.9% against class 12’s 19.1%, and median pay of ₹18,000 against ₹15,000. On the composite it is worth 1.50 times class 12.
Every other tertiary route is worth more, most of them much more. The general diploma reaches 2.83, the below-graduate engineering diploma 3.12, and the engineering degree 6.92. The plain bachelor’s degree, which 18% of the age band holds, has the weakest return of any qualification past class 12.
5. Where the return actually comes from
Section titled “5. Where the return actually comes from”Splitting employment from pay shows that the pathways get to their totals by different routes. Against class 12 in the same age band:
Table 3. Decomposing the composite, ages 25 to 29
| Pathway | Employment | Pay if employed | Composite |
|---|---|---|---|
| Class 10 | 0.92x | 0.93x | 0.86x |
| General degree | 1.32x | 1.20x | 1.58x |
| General PG degree | 1.67x | 1.67x | 2.78x |
| General diploma (below graduate) | 2.38x | 1.20x | 2.86x |
| Other technical diploma | 1.84x | 1.23x | 2.27x |
| Other technical degree | 1.85x | 1.67x | 3.08x |
| Engineering diploma (below graduate) | 2.64x | 1.20x | 3.17x |
| Engineering diploma (graduate+) | 2.99x | 2.33x | 6.99x |
| Engineering degree | 3.12x | 2.33x | 7.29x |
A below-graduate engineering diploma is almost pure employment gain. It is 2.64 times class 12 on getting a regular salaried job and 1.20 times on pay, the same pay multiple as a general degree. It works by getting its holder hired, not by paying them better, and on the composite it still beats a general degree by two to one.
The graduate level is the dividing line, not diploma against degree. A graduate-level engineering diploma (2.99x employment, 2.33x pay) sits with the engineering degree (3.12x, 2.33x), not with the below-graduate diploma. The same appears in pay levels: ₹30,000 and ₹35,000 against ₹18,000.
Postgraduate study adds on both margins. A general postgraduate degree is 1.67x on employment and 1.67x on pay, giving 2.78x on the composite against the plain degree’s 1.58x. Splitting graduate from postgraduate matters: pooling them, as an earlier version of this paper did, credited the bachelor’s degree with returns that belong to the master’s.
6. Over a career: employment, pay, and the two combined
Section titled “6. Over a career: employment, pay, and the two combined”Age bands stop at 41 to 45. Beyond that the sampled cells thin out on exactly the pathways of interest, and because tertiary qualifications were much rarer decades ago the older holders are a differently selected group, so the numbers stop being comparable rather than merely getting noisier.
Table 4. Formal-job rate by pathway and age band (% of all persons in the pathway)
| Pathway | 25-29 | 30-34 | 35-40 | 41-45 |
|---|---|---|---|---|
| Below class 10 | 11.0 | 11.8 | 11.7 | 10.3 |
| Class 10 | 18.1 | 17.6 | 19.4 | 20.7 |
| Class 12 | 19.7 | 21.8 | 23.9 | 25.0 |
| General diploma (below graduate) | 46.9 | 36.3 | 43.1 | 51.2 |
| General degree | 25.9 | 32.0 | 37.1 | 36.4 |
| General PG degree | 32.8 | 39.3 | 46.6 | 49.1 |
| Other technical diploma | 36.3 | 45.8 | 55.0 | 61.1 |
| Other technical degree | 36.4 | 46.4 | 55.1 | 57.7 |
| Other technical PG degree | 47.0 | 51.9 | 58.3 | 66.5 |
| Medical diploma | 43.5 | 50.4 | 55.1 | 41.4 |
| Medical degree | 46.4 | 54.5 | 52.8 | 57.6* |
| Medical PG degree | 67.4* | 73.3* | 44.7* | 75.7* |
| Engineering diploma (below graduate) | 52.0 | 54.8 | 59.3 | 53.1 |
| Engineering diploma (graduate+) | 59.0 | 60.9 | 74.3 | 64.0 |
| Engineering degree | 61.5 | 67.7 | 74.9 | 76.6 |
| Engineering PG degree | 63.4 | 63.8 | 68.1 | 83.6 |
Table 5. Median monthly wage of those employed
| Pathway | 25-29 | 30-34 | 35-40 | 41-45 |
|---|---|---|---|---|
| Below class 10 | ₹12,000 | ₹12,000 | ₹12,000 | ₹12,000 |
| Class 10 | ₹14,000 | ₹15,000 | ₹15,000 | ₹15,000 |
| Class 12 | ₹15,000 | ₹15,000 | ₹16,000 | ₹18,000 |
| General diploma (below graduate) | ₹18,000 | ₹18,000 | ₹21,000 | ₹25,000* |
| General degree | ₹18,000 | ₹20,700 | ₹25,000 | ₹35,000 |
| General PG degree | ₹25,000 | ₹30,000 | ₹35,000 | ₹43,000 |
| Other technical diploma | ₹18,500 | ₹22,500 | ₹30,000 | ₹40,000 |
| Other technical degree | ₹25,000 | ₹30,000 | ₹35,000 | ₹40,000 |
| Other technical PG degree | ₹24,000 | ₹31,000 | ₹40,000 | ₹45,000 |
| Medical diploma | ₹20,000 | ₹22,000 | ₹32,500 | ₹45,000* |
| Medical degree | ₹25,000 | ₹25,000 | ₹35,000* | ₹40,000* |
| Medical PG degree | ₹55,000* | ₹50,000* | ₹62,000* | ₹75,000* |
| Engineering diploma (below graduate) | ₹18,000 | ₹22,000 | ₹28,000 | ₹30,000 |
| Engineering diploma (graduate+) | ₹35,000 | ₹40,000 | ₹55,000 | ₹65,000* |
| Engineering degree | ₹35,000 | ₹45,000 | ₹52,000 | ₹65,000 |
| Engineering PG degree | ₹35,000 | ₹50,000 | ₹68,700 | ₹65,000* |
Table 6. The composite: expected monthly earnings
| Pathway | 25-29 | 30-34 | 35-40 | 41-45 |
|---|---|---|---|---|
| Below class 10 | ₹1,325 | ₹1,419 | ₹1,402 | ₹1,235 |
| Class 10 | ₹2,536 | ₹2,635 | ₹2,913 | ₹3,099 |
| Class 12 | ₹2,953 | ₹3,275 | ₹3,817 | ₹4,505 |
| General diploma (below graduate) | ₹8,445 | ₹6,533 | ₹9,051 | ₹12,795* |
| General degree | ₹4,666 | ₹6,629 | ₹9,268 | ₹12,752 |
| General PG degree | ₹8,201 | ₹11,791 | ₹16,315 | ₹21,130 |
| Other technical diploma | ₹6,718 | ₹10,296 | ₹16,513 | ₹24,453 |
| Other technical degree | ₹9,096 | ₹13,921 | ₹19,295 | ₹23,095 |
| Other technical PG degree | ₹11,284 | ₹16,088 | ₹23,307 | ₹29,907 |
| Medical diploma | ₹8,703 | ₹11,093 | ₹17,917 | ₹18,636* |
| Medical degree | ₹11,605 | ₹13,637 | ₹18,497* | ₹23,025* |
| Medical PG degree | ₹37,082* | ₹36,657* | ₹27,700* | ₹56,793* |
| Engineering diploma (below graduate) | ₹9,358 | ₹12,045 | ₹16,602 | ₹15,915 |
| Engineering diploma (graduate+) | ₹20,634 | ₹24,374 | ₹40,858 | ₹41,569* |
| Engineering degree | ₹21,527 | ₹30,455 | ₹38,955 | ₹49,780 |
| Engineering PG degree | ₹22,178 | ₹31,895 | ₹46,806 | ₹54,363* |
Four patterns.
Below class 10 is the only pathway that goes backwards. Employment falls from 11.0% to 10.3% and pay does not move at all, so the composite declines from ₹1,325 to ₹1,235 across twenty years. Every other pathway rises.
Class 10 and class 12 are nearly flat. Class 12 pay moves from ₹15,000 to ₹18,000 over twenty years and its composite from ₹2,953 to ₹4,505. School alone does not compound.
The engineering degree’s advantage migrates from employment to pay. At 25 to 29 it is 3.12 times class 12 on employment and 2.33 times on pay. By 41 to 45 employment has stopped improving while pay keeps compounding, and the composite has gone from 7.29 to about 11 times. Its holders start at ₹35,000 and reach ₹65,000.
The below-graduate engineering diploma stalls where the degree does not. Its composite runs ₹9,358, ₹12,045, ₹16,602, then ₹15,915. The degree at the same ages runs ₹21,527 to ₹49,780. So the diploma buys early access to regular salaried work and then plateaus, and the gap between the two widens with age rather than closing.
What not to read. Medical postgraduate is under 100 sampled people in every band; its ₹185,000 75th percentile in Table 2 and its swings in Tables 4 to 6 are artefacts. Medical degree is starred from 35 to 40 onward. The general diploma bounces (46.9, 36.3, 43.1, 51.2) on 253 to 394 sampled people per band, so its level is informative and its path is not.
7. How much tertiary education pays, and who reaches that part
Section titled “7. How much tertiary education pays, and who reaches that part”7.1 The size of the paying pathways
Section titled “7.1 The size of the paying pathways”31.9% of 24 to 28 year-olds hold a tertiary qualification. Only 9.1% hold a technical or vocational one. So about seven in ten Indian tertiary qualifications are general degrees or postgraduate degrees with no technical component, and the plain bachelor’s degree alone is 18.0% of the age band, more than twice every technical pathway combined.
Put another way: fewer young people hold a technical qualification (9.1%) than stopped at class 10 (13.1%).
7.2 Who reaches them
Section titled “7.2 Who reaches them”This question needs a clean origin measure, because a young engineer’s own salary raises their household’s consumption and would make the return look like an origin effect. Sections 7.2 and 7.3 therefore restrict to unmarried children of the household head, where household consumption reflects the parents.
Table 7. Composition of each consumption fifth, at-home sample, ages 24-28
| Fifth | Household consumption band | Mean annual household consumption | n | Mean household size | % rural | % SC, ST or OBC | % female |
|---|---|---|---|---|---|---|---|
| Poorest | under ₹1.3 lakh | ₹1.01 lakh | 4,242 | 6.07 | 76.7% | 84.1% | 30.2% |
| Second | ₹1.3 to 1.5 lakh | ₹1.34 lakh | 5,462 | 5.30 | 75.9% | 80.6% | 27.8% |
| Third | ₹1.5 to 1.7 lakh | ₹1.57 lakh | 7,145 | 4.77 | 70.5% | 77.6% | 25.9% |
| Fourth | ₹1.7 to 2.3 lakh | ₹1.90 lakh | 9,054 | 4.32 | 62.6% | 73.2% | 26.5% |
| Richest | above ₹2.3 lakh | ₹3.04 lakh | 10,335 | 3.83 | 39.7% | 59.1% | 29.0% |
The fifths differ on much more than consumption. The poorest is 77% rural against the richest’s 40%, and 84% SC, ST or OBC against 59%. Household size falls from 6.1 to 3.8, which is a large part of why per-person consumption differs at all. Nothing below is adjusted for these, so the access gradient is a gross association that carries geography, social group and family size inside it.
Table 8. Access to the paying pathways by household consumption fifth
| Fifth | Mean annual household consumption | Any tertiary qualification | On a technical pathway | n on technical pathway | Of those with any tertiary, share on a technical pathway | n with tertiary |
|---|---|---|---|---|---|---|
| Poorest | ₹1.01 lakh | 34.6% | 4.3% | 209 | 12.5% | 1,535 |
| Second | ₹1.34 lakh | 38.8% | 7.2% | 430 | 18.6% | 2,256 |
| Third | ₹1.57 lakh | 42.9% | 9.6% | 712 | 22.4% | 3,319 |
| Fourth | ₹1.90 lakh | 50.2% | 14.3% | 1,279 | 28.4% | 4,789 |
| Richest | ₹3.04 lakh | 69.0% | 27.7% | 2,719 | 40.2% | 7,345 |
7.3 The gap, and which part of it is new
Section titled “7.3 The gap, and which part of it is new”Two gaps, saying different things.
Access to a technical pathway at all: 4.3% against 27.7%, about 6.4 times. That is the poorest fifth, whose households consume about ₹1.01 lakh a year, against the top fifth at about ₹3.04 lakh. Part of the gap is that poorer young people are less likely to reach tertiary education at all, 34.6% against 69.0%.
Conditional on reaching tertiary education: 12.5% against 40.2%, about 3.2 times. This is the part that survives holding college entry fixed. Among young people from the poorest fifth who did reach a tertiary qualification, about seven in eight are on a general degree or postgraduate degree, the pathways with the weakest returns in Table 2. Among the top fifth it is about three in five.
The access problem therefore has two stages, and the second is not solved by getting more poor students into college. It is about which course and which institution they reach once there.
8. What this analysis does not show
Section titled “8. What this analysis does not show”No causal claim. Nothing here is randomised or instrumented. Someone who obtains an engineering qualification differs from someone who stops at a general degree in prior schooling, family support, information and ability, none of which PLFS records. Part of every gap in Table 4 belongs to those differences. The size of that part is unknown and is likely largest for the pathways with the highest returns, because those are the most selective. The correct reading of Table 4 is a comparison of outcomes across groups, not the effect of moving a given person between them.
No institution and no field of study. This is the binding limitation. PLFS cannot distinguish a top-ranked engineering college from a tier-four private one. The reading that much of the remaining variation is institutional quality is consistent with these results and is not tested by them.
The consumption ranking is coarse and is not income. PLFS collects expenditure in five components where the dedicated consumption survey collects an item-level schedule, and 89.4% of calendar-2025 households share their per-person consumption value with another household. The fifths are a defensible relative ranking and are not equivalent to income fractiles.
“Rich” here is not rich. The top fifth is a household consuming about ₹3.0 lakh a year with under four members; the bottom fifth about ₹1.0 lakh. In consumption terms 98.3% of Indians live in households below ₹5 lakh a year and 99.1% below ₹6 lakh, so both Avanti’s ₹5 lakh eligibility ceiling and the government’s ₹8 lakh EWS ceiling are close to non-binding on this measure. India’s professional class is a sliver inside the top fifth and is not separately identifiable, so every gap here understates the distance to it.
The access results are conditional on living with parents. Only 18.8% of the poorest fifth’s 24 to 28 year-olds do, against 40.2% of the richest, and PLFS’s migration variables are unpopulated in this release, so those who left cannot be observed. If poor young people who left home did so because they found work elsewhere, the access gap is overstated; if they left because there was nothing locally, it is understated. The direction cannot be signed.
The wage curves are synthetic. Section 6 compares age groups, not people over time.
Formal employment is a minority of work. 22.4% of this age band. The pay results describe the formal sector and say little about the self-employed and casual majority.
9. Discussion
Section titled “9. Discussion”In this data the credential and the return have come apart. India produces general degrees at nine times the rate it produces technical and vocational qualifications, and the general degree is associated with a six percentage point gain in formal employment over class 12 while the technical qualifications are associated with 17 to 31 points. Expanding tertiary enrolment along the current mix would move the average outcome very little.
For Avanti the results are supportive in one direction and pointed in another. Supportive, in that the pathways Avanti targets are the ones with the returns, by a wide margin, and the diploma result suggests the vocational route is underused rather than ineffective. Pointed, in that the organisation measures exam qualification and admission, while the gap this data locates most cleanly sits after admission: of poor students who reach tertiary education, about nine in ten are on the pathway that pays least.
Several mechanisms are consistent with what we observe and this analysis separates none of them: institutional quality and field of study; the small size of India’s formal sector relative to its graduate stock; geography and the ability to migrate to an urban labour market; information about which qualifications pay; networks and referral hiring; and the fee and entrance-exam barriers specific to technical courses. The last is the one Avanti’s model addresses, and it is a hypothesis this paper motivates rather than confirms.
On intergenerational persistence, the reference for India is Asher, Novosad and Rafkin (2024), who use the 2011-12 India Human Development Survey because it asks about parents retrospectively. Their measure is an education rank across generations and their central result is that upward mobility in that rank stayed flat despite large gains in average education levels, which is a caution against reading rising enrolment as rising mobility. PLFS cannot replicate that measure credibly. It can link a young person to a co-resident parent’s education, but only for those still living at home, and that group is selected on the outcome: educated young people, and especially unmarried women, stay home longer. A co-resident estimate on this data puts daughters of less-educated parents above the mid-point of their own cohort, which is not believable and is a diagnostic of the selection rather than a finding. IHDS-3 fieldwork was completed in June 2024 and the microdata is not yet public; when it is released it will be the right instrument for that question.
The next step is the decomposition PLFS cannot do. Linking NIRF rankings, JoSAA and state admission cutoffs, and alumni outcomes would test whether the residual gap is institutional selectivity, and would attach a return to the specific institutions Avanti students reach.
10. What this changes
Section titled “10. What this changes”For Avanti
Section titled “For Avanti”- Measure what happens after admission, not only exam qualification and college entry. The gap this data locates most cleanly is which pathway a poor student ends up on, and it is not currently tracked.
- Treat the diploma and vocational route as a live option rather than a consolation. On expected earnings it is worth 1.7 times a general degree at a fraction of the cost, and 1.9% of poor-origin young people are on it.
- Stop using PLFS consumption percentiles to justify the ₹5 lakh eligibility ceiling. On this measure 98.3% of India falls below it, so it does not discriminate.
- Commission the institution-level analysis in section 9, which is the only way to test the selectivity hypothesis this paper leaves open.
For the data team
Section titled “For the data team”- The households schema documented the wrong join key.
hh_idalone is not unique and needs the segment field. This produced a one-to-many join in an earlier version of this analysis. - Document the calendar-2025 sample expansion and its weighting rule, since any analysis defaulting to the latest release inherits both.
- Load HCES, so that consumption can be mapped to income properly. PLFS cannot do it.
11. Reproducibility
Section titled “11. Reproducibility”| Artefact | Built by | Output |
|---|---|---|
| Pre-flight diagnostics | diagnose.py |
output/diagnostics.md |
| Sections 4 to 7, all tables and figures | analyze_returns.py |
output/replication_pathway_*.csv, fig_returns.png, fig_employment_pay_composite.png, fig_access.png |
| BigQuery access, weighted quantiles, consumption fractiles, cluster bootstrap | plfs.py |
(imported) |
| Number check against the generated tables | check_paper.py |
pass or fail |
Run order: diagnose.py, analyze_returns.py, check_paper.py.
Queries go to BigQuery over the REST API with curl -4. The bq CLI hangs indefinitely on networks whose
IPv6 path black-holes, because Python’s socket layer selects the AAAA record with no fallback. Results cache
to output/_cache_*.csv, keyed on a hash of the SQL so an edited query cannot return a stale result;
BQ_REFRESH=1 forces a fresh pull. Authentication prefers application-default credentials over the gcloud
CLI, which fails non-interactively once its session hits the reauthentication window.
Four defects in this folder’s own tooling produced wrong published numbers in earlier drafts rather than errors, and are recorded because each is easy to repeat:
hh_idis not unique within a release and needs the segment field, as in section 3.1.- The query cache was keyed on a caller-supplied name rather than on the SQL, so editing a query returned the old result indefinitely.
bq()read only the first page of results. BigQuery caps a response by payload size as well as row count, returning a page token and no error, so one frame came back with 38,888 of 40,743 rows. It now paginates and refuses any frame whose row count disagrees with BigQuery’s own total.- A weighted mean was divided by a weighted median in a ratio reported in an earlier draft.
- The qualification buckets missed a third of the technical-education code list. Only eight of the sixteen technical codes were mapped, so every below-graduate technical diploma (3,412 people in the headline age band) was classified by general education instead. That made a bucket labelled “diploma or certificate” look like a strong non-technical pathway when most of its members held technical diplomas, including engineering. Section 3.2 sets out the corrected mapping.
Cell-level replication extracts (aggregates, no personally identifiable information) are published to
gs://avantifellows-bq-assistant/analysis/plfs-mobility-and-wages/:
replication_pathway_returns.csv, replication_pathway_employment_by_age.csv,
replication_pathway_wage_curve.csv, replication_pathway_composite.csv,
replication_pathway_thresholds.csv, replication_pathway_access.csv,
replication_pathway_composition.csv.
References
Section titled “References”Ministry of Statistics and Programme Implementation. Periodic Labour Force Survey, Calendar Year 2025,
unit-level microdata, catalog 284 (microdata.gov.in). Loaded to
avantifellows.external_data_sources.plfs_fact_persons and plfs_fact_households.
Asher, S., Novosad, P. and Rafkin, C. (2024). “Intergenerational Mobility in India: New Measures and Estimates across Time and Social Groups.” American Economic Journal: Applied Economics, 16(2). doi:10.1257/app.20210686.
India Human Development Survey. Round 3 fieldwork completed June 2024; microdata not public as of August 2026. Rounds 1 (2004-05) and 2 (2011-12) are distributed via ICPSR studies 22626 and 36151 (ihds.umd.edu/data/data-download).
Press Information Bureau, Government of India, Ministry of Social Justice and Empowerment (9 February 2022). “Income Limit for OBC/EWS.” Rajya Sabha written reply, PRID 1796870. Source of the ₹8 lakh gross annual family income ceiling cited in section 8.