What an Indian degree is actually worth
Reconciles NIRF’s published placement and salary disclosures against MoSPI PLFS survey microdata. Both sources are public; every figure is an aggregate. No Avanti student data and no personally identifiable information.
📄 Download the PDF · 📊 The workbook, every college · 📁 All data and charts
Built on public data: NIRF’s college scorecards, the government’s own labour force survey, and AISHE’s degree records. August 2026.
Every year about 7.78 million Indians finish an undergraduate degree.
In the first years after they leave, one in ten holds a formal job — regular salaried work with a contract or social security. Seven in a thousand hold one that pays ₹50,000 a month.
That is 55,108 good jobs, across the whole country, for a graduating cohort of 7.78 million.
India’s ranked colleges say they produced 83,764 of them.
The two numbers, by field
Section titled “The two numbers, by field”Measured over the three years from each course’s normal completion age, which is when a college’s placement figure is supposed to come true.
| Finish each year | In formal work | Earning ≥₹6 lakh | |||
|---|---|---|---|---|---|
| Engineering | 784,517 | 271,802 | 34.6% | 34,689 | 4.42% |
| Doctors (MBBS, BDS) | 85,934 | 22,869 | 26.6% | 8,586 | 9.99% |
| Everything else | 6,905,549 | 521,569 | 7.6% | 11,833 | 0.17% |
| All graduates | 7,776,000 | 816,240 | 10.5% | 55,108 | 0.71% |
Everything else is arts, science, commerce, law, management, agriculture, nursing, pharmacy, architecture — 89% of everyone who graduates. Fewer than two in a thousand of them will be earning ₹50,000 a month in their first years out.
A further 9.3% of all graduates are earning informally — self-employed, or salaried with neither a contract nor benefits. That is real work, and it is counted, separately, because it is not what a campus placement is.
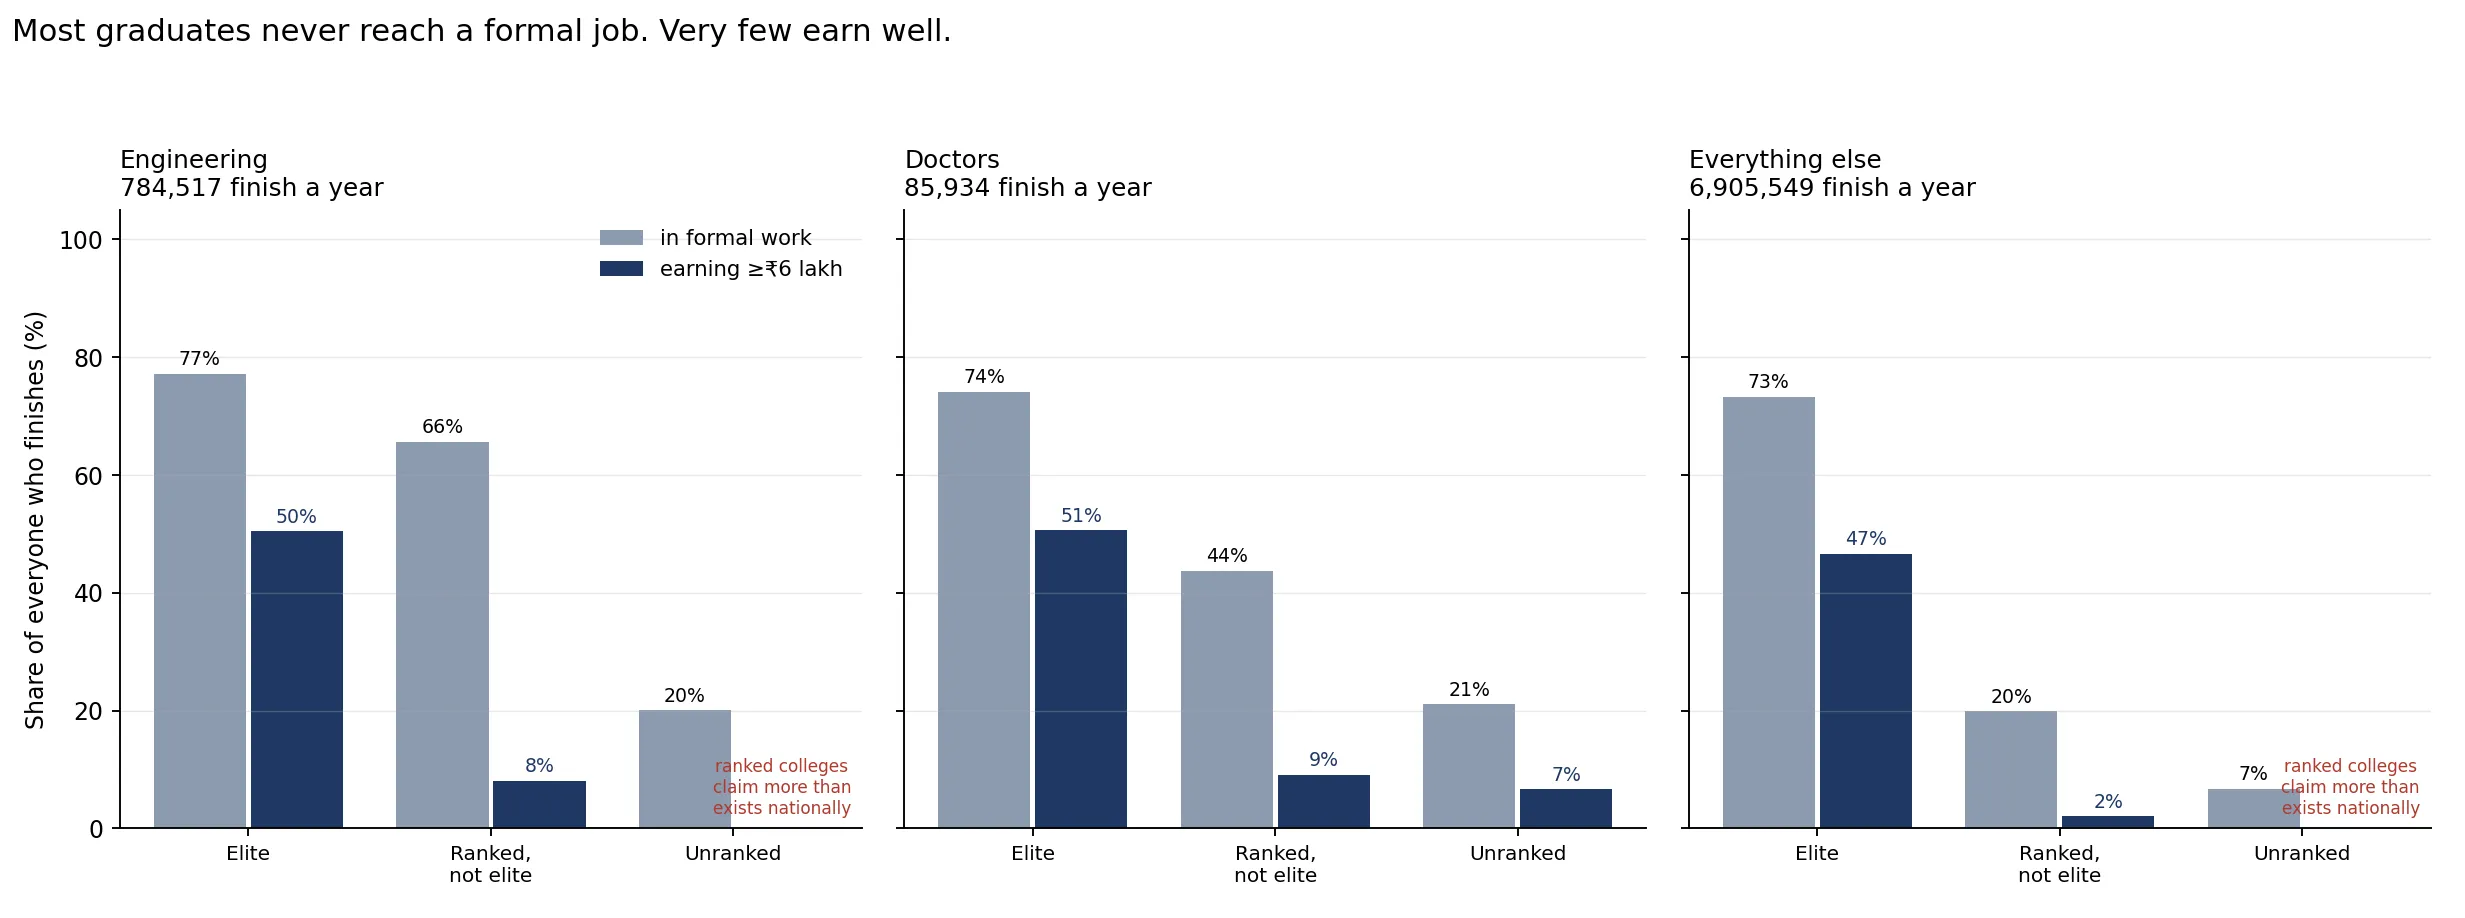
Placement reconciles. Salary does not.
Section titled “Placement reconciles. Salary does not.”NIRF’s ranked colleges file two things: how many students they placed, and what those students were paid. The first survives contact with the national data. The second does not.
| Field | Ranked colleges claim | Exists nationally | Room left | ||
|---|---|---|---|---|---|
| Engineering | placed | 159,731 | 271,802 | 112,071 | 0.59× |
| Engineering | ≥₹6 lakh | 62,612 | 34,689 | −27,924 | 1.80× |
| Doctors | placed | 7,443 | 22,869 | 15,426 | 0.33× |
| Doctors | ≥₹6 lakh | 3,748 | 8,586 | 4,838 | 0.44× |
| Everything else | placed | 82,767 | 521,569 | 438,802 | 0.16× |
| Everything else | ≥₹6 lakh | 17,404 | 11,833 | −5,571 | 1.47× |
263 ranked engineering colleges claim 62,612 graduates earning ₹6 lakh or more. The country contains about 34,689 such jobs for engineering graduates at that stage. The claim is 1.8 times the national total — and that is after we have already cut every reported salary by 20%.
Their placement claims, by contrast, fit comfortably: 159,731 against a national 271,802, leaving 112,071 formal jobs for the 2,594 colleges NIRF does not rank. Nothing is impossible there.
This is exactly the shape of our own haircut decision, arrived at independently: discount NIRF’s salaries, don’t discount its placement rates. The gap is in what colleges say students are paid, not in how many got hired.
The over-claim is in the tail of the ranking, not the top
Section titled “The over-claim is in the tail of the ranking, not the top”It would be easy, and wrong, to read the above as “NIRF is inflated”. Split the ranked engineering colleges into the audited public institutions and everyone else:
| Colleges | UG graduates | Jobs ≥₹6 lakh | Filed median | |
|---|---|---|---|---|
| IIT | 22 | 13,536 | 9,844 | ₹17.52L |
| NIT | 28 | 19,128 | 10,991 | ₹10.28L |
| IIIT | 5 | 1,122 | 788 | ₹11.00L |
| The public elite | 55 | 33,786 | 21,623 | |
| Every other ranked college | 208 | 191,227 | 40,990 | ₹5.00L |
The IITs, NITs and IIITs account for 62% of every entry-level ₹6 lakh job in the country, from 4% of engineering graduates. They fit inside the national pool with room to spare for BITS and the strongest private colleges. Their placement reports are public and audited, and nothing about them strains belief.
The other 208 ranked colleges claim a further 40,990 — more, by themselves, than the entire national pool. That is where the arithmetic breaks.
The top of the ranking is credible. Its tail is not.
The exams
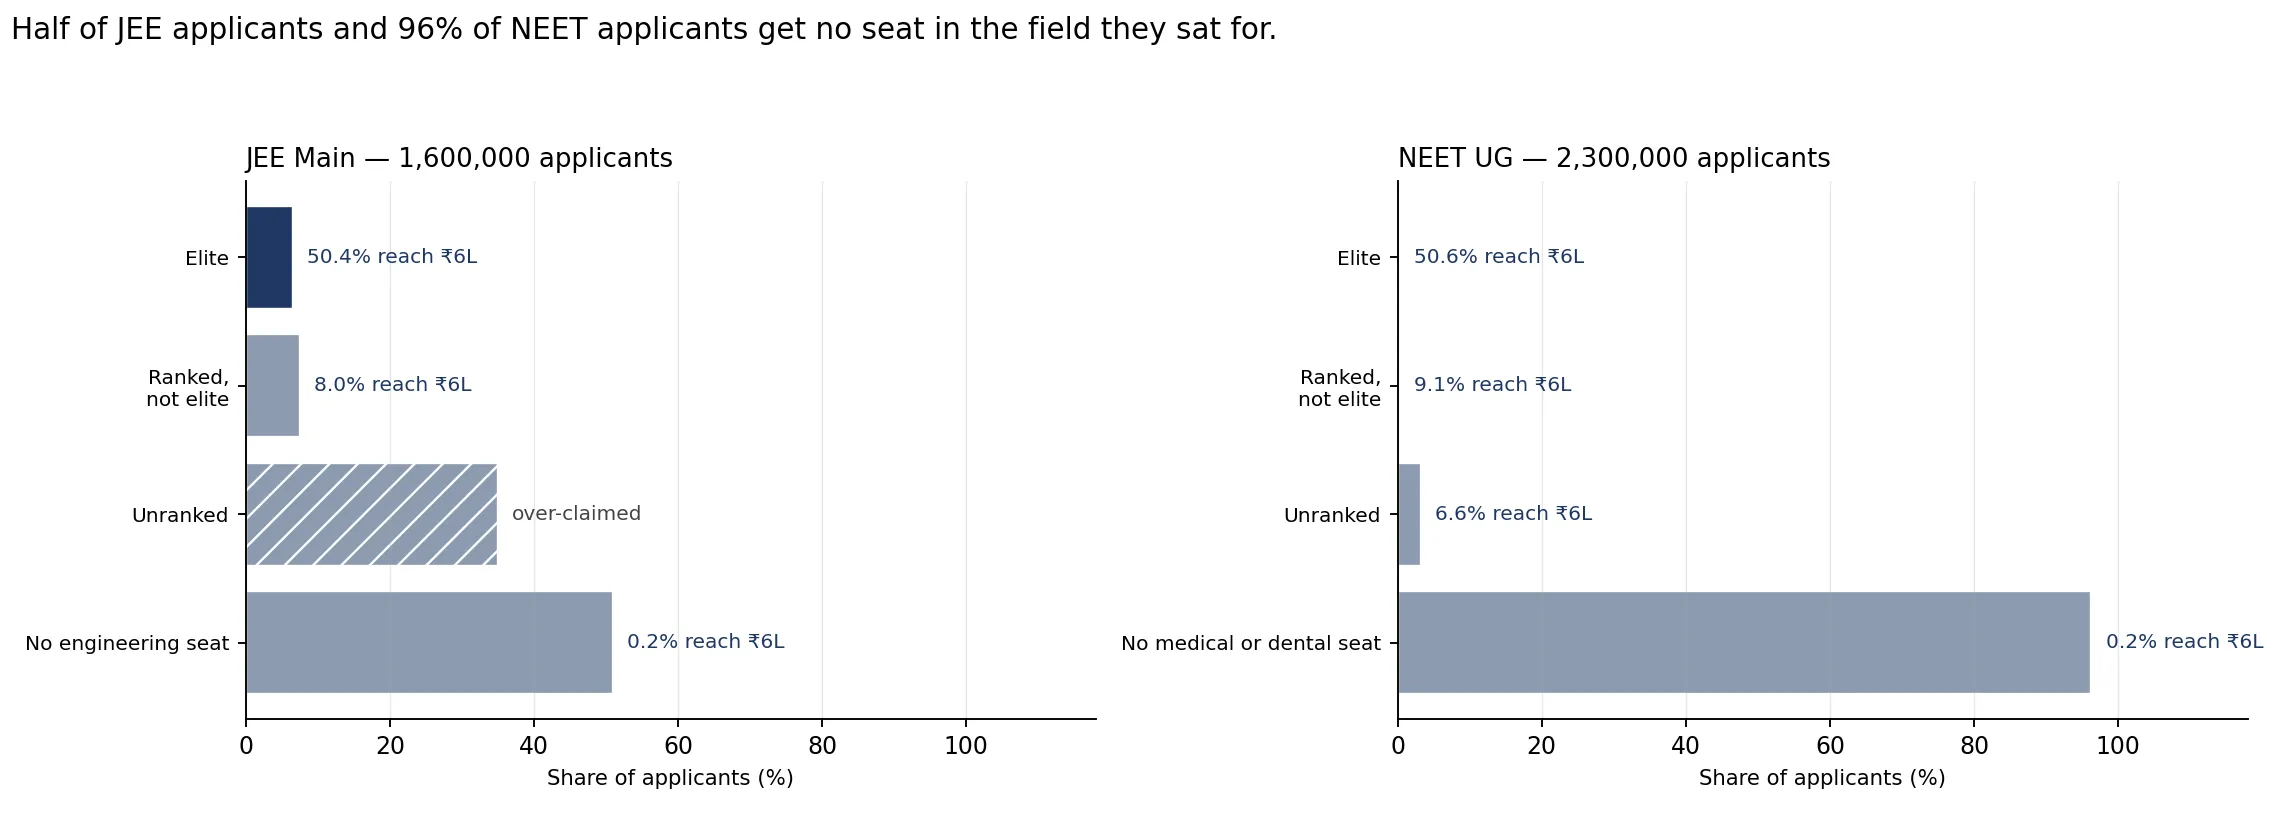
Section titled “The exams”Sixteen lakh students sit JEE Main each year. Twenty-three lakh sit NEET. This is where they land.
JEE Main
Section titled “JEE Main”| Ends up | People | Share | In a job | ≥₹6L | Placed | Median | Expected | Odds |
|---|---|---|---|---|---|---|---|---|
| Elite engineering | 105,054 | 6.6% | 81,047 | 52,966 | 77% | ₹8.40L | ₹6.48L | 50.4% |
| Ranked, not elite | 119,959 | 7.5% | 78,684 | 9,647 | 66% | ₹3.46L | ₹2.27L | 8.0% |
| Unranked engineering | 559,504 | 35.0% | 112,071 | — | 20% | — | — | — |
| No engineering seat | 815,483 | 51.0% | 61,593 | 1,397 | 8% | ₹2.04L | ₹0.15L | 0.2% |
NEET UG
Section titled “NEET UG”| Ends up | People | Share | In a job | ≥₹6L | Placed | Median | Expected | Odds |
|---|---|---|---|---|---|---|---|---|
| Elite medical | 6,257 | 0.3% | 4,636 | 3,166 | 74% | ₹8.48L | ₹6.28L | 50.6% |
| Ranked, not elite | 6,426 | 0.3% | 2,807 | 582 | 44% | ₹3.84L | ₹1.68L | 9.1% |
| Unranked medical | 73,251 | 3.2% | 15,426 | 4,838 | 21% | ₹4.82L | ₹1.02L | 6.6% |
| No medical seat | 2,214,066 | 96.3% | 167,226 | 3,794 | 8% | ₹2.04L | ₹0.15L | 0.2% |
Expected earnings is the median salary multiplied by the chance of being placed at all — what a student faces on the day they enrol, before they know whether they will be one of the lucky ones.
Half of everyone at an elite engineering college clears ₹6 lakh. One in twelve at the ranked colleges below them. Half the students who sit JEE Main get no engineering seat at all, and land on odds of one in five hundred.
The unranked engineering row is left blank above because the arithmetic that fills it is the subject of the section before this one: once ranked colleges have claimed 62,612 of a national 34,689, there is nothing left to allocate.
What everyone else does
Section titled “What everyone else does”Formal work is a minority outcome. Here is what the rest are doing, and what it pays a month.
| Formal | Informal salaried | Self-employed | |
|---|---|---|---|
| Engineering | ₹30,000 (n=304) | ₹15,000 (n=34) | ₹20,000 (n=24) |
| Doctors | ₹40,000 (n=24) | ₹21,700 (n=4) | ₹25,000 (n=9) |
| Other health | ₹15,180 (n=37) | ₹12,000 (n=17) | ₹17,000 (n=3) |
| Everything else | ₹17,500 (n=1,057) | ₹10,000 (n=935) | ₹10,300 (n=695) |
Informal work pays about half what formal work pays, in every field. Doctors are the one group whose informal work is decently paid, and even there it is a handful of people doing locum shifts, not private practice — at 24 to 26, 63% of them are still studying for postgraduate entrance.
Among engineering graduates who do reach formal work, 58% are in computer programming and consultancy at a median of ₹32,600 a month. That is the mass-recruiter band, and it is the single most important fact about Indian engineering employment: the industry that hires most engineers pays them ₹3.9 lakh, not ₹6 lakh.
Supporting analysis
Section titled “Supporting analysis”The full method, every decision and its reasoning, and the bugs found along the way are in
METHOD.md. The short version follows.
Where the numbers come from
Section titled “Where the numbers come from”| Number | Source | Year |
|---|---|---|
| 7,776,000 UG graduates a year | AISHE | 2023-24 |
| 784,517 engineering graduates | AISHE, Engineering & Technology | 2022-23 |
| 85,934 doctors (65,836 MBBS + 20,098 BDS) | AISHE, by programme | 2023-24 |
| 2,857 engineering colleges | AICTE | 2022-23 |
| 780 medical + 323 dental colleges | NMC seat matrix, DCI | 2024-25 |
| Placements and salaries at ranked colleges | NIRF scorecards | mostly 2025 |
| Every rate — employment, earnings | PLFS microdata | CY2025 |
| 16 lakh JEE and 23 lakh NEET applicants | NTA, as supplied | 2025-26 |
Counts come from AISHE, rates from PLFS, claims from NIRF. No source is used for what it is bad at.
Why the small national pool is believable
Section titled “Why the small national pool is believable”₹6 lakh a year is ₹50,000 a month. Among engineering graduates aged 22–24 who are in salaried work, that sits at the 90th percentile — the median is ₹28,000 and the 99th percentile ₹78,000. It is a genuinely top-decile fresher outcome, not a middle-class one.
The natural objection is that PLFS, a household survey, misses well-paid young engineers living in
shared urban rentals. Three checks say it does not, and they are reproducible —
check_pool_plausibility.py and check_plfs_pool_ci.py.
- The audited anchor. If PLFS were blind to elite young engineers, the IITs and NITs alone would overflow the national pool. They fill 62% of it.
- Coverage. 71% urban, and 58% of employed engineering graduates are in software. The frame is finding the right people; software simply pays ₹3.9 lakh at entry.
- Sampling. Bootstrapped over 916 first-stage units, because PLFS is clustered and treating people as independent understates the error by a factor of four. The rate is 4.42%, CI [2.19%, 7.19%]. Even the upper bound leaves the pool at 56,441 — short of NIRF’s 62,613.
We discount NIRF’s salaries by 20%, and its placement rates not at all
Section titled “We discount NIRF’s salaries by 20%, and its placement rates not at all”Colleges report their own placement salaries to NIRF, unaudited, and the figure feeds their ranking. Cost-to-company bundles what never reaches a payslip — employer provident fund is 5–6% of it, gratuity about 2%, unrealised variable pay 3–5%, annualised joining bonuses 1–3%. Eleven to sixteen percent before anyone exaggerates.
Three independent checks agree. Avanti’s own alumni started on 0.75× what their colleges filed. Delhi Technological University’s per-student NAAC list shows a ₹10.50 lakh median against ₹13.25 lakh filed to NIRF. And the arithmetic gets there from statutory contribution rates alone.
We apply no discount to placement rates. We looked for evidence and could not find it: NIRF’s internal arithmetic is consistent, AICTE’s placement series is unusable, and our own alumni turn out more employed than their colleges claim. An unevidenced haircut is not better than none. The reconciliation above is the vindication — placement fits, salary does not.
What a single median hides
Section titled “What a single median hides”NIRF publishes one median per college, not a distribution, so salaries within a college are modelled as log-normal around it. Treating a college as wholly above or below ₹6 lakh would credit a ₹4 lakh college with no good jobs at all.
This assumption is not load-bearing. Across spreads from σ=0.20 to σ=0.80 the ranked total moves between 58,000 and 69,000 and the over-claim stays between 1.67× and 1.98×. Removing the distribution entirely lands within 1.2% of the same answer. The result is a property of what colleges file, not of the curve laid over it.
A correction
Section titled “A correction”An earlier version of this analysis reported that ranked colleges accounted for more than 100% of India’s good jobs. Part of that was our own error: the source table summed duplicate rows, so 54 institutes had every figure multiplied, including median salary, which cannot be summed. We caught it against the scorecards NIRF itself publishes, and the bug is filed.
The over-claim reported here is a different finding, reached after that fix, and it rests on matching the timing of the comparison rather than on the arithmetic that broke.
What we are least sure about
Section titled “What we are least sure about”The doctors row rests on small cells — 94 people, 7 of them above ₹6 lakh. PLFS cannot separate MBBS holders from nurses on education, so doctors are identified by occupation, which makes both rates an upper bound. Directionally sound, not precise.
The exam funnels are indicative. Not every engineering entrant sits JEE Main, so the 51% with no engineering seat is overstated; that group also includes repeaters and people who never enrol.
None of this is causal. Elite colleges select hard on entrance rank, and their graduates would earn more than average whoever taught them. This describes who holds the jobs, not what produced them.
Everything is at storage.googleapis.com/avantifellows-bq-assistant/analysis/nirf-college-employability/
| File | What it is |
|---|---|
nirf_college_employability.xlsx |
Every college, course by course, with a link to its NIRF scorecard |
tier_tables.csv |
The tier tables, machine-readable |
reconciliation.csv |
Ranked claims against national totals |
national_totals.csv |
Formal and informal, by field |
exam_funnels.csv |
Where JEE and NEET applicants land |
Method in METHOD.md, rebuild steps in TECHNICAL.md. The NAAC and
NIRF documents behind the assumptions are catalogued in SOURCES.md, archived
privately because the per-student placement lists name individual students.