NIRF college × course employability
College-by-college, programme-by-programme placement and salary outcomes for every institute in our NIRF copy, at each one’s latest available scorecard year — plus a per-category summary, histograms of jobs by college median salary and of colleges by placement rate, and an overlay against the PLFS national earnings distribution.
Published copies
Section titled “Published copies”Everything in output/, plus the one-pager PDF, is mirrored to GCS and world-readable:
https://storage.googleapis.com/avantifellows-bq-assistant/analysis/nirf-college-employability/<filename>- One-pager (PDF)
- Reconciliation (csv)
- Workbook (xlsx)
- NIRF vs PLFS overlay (png)
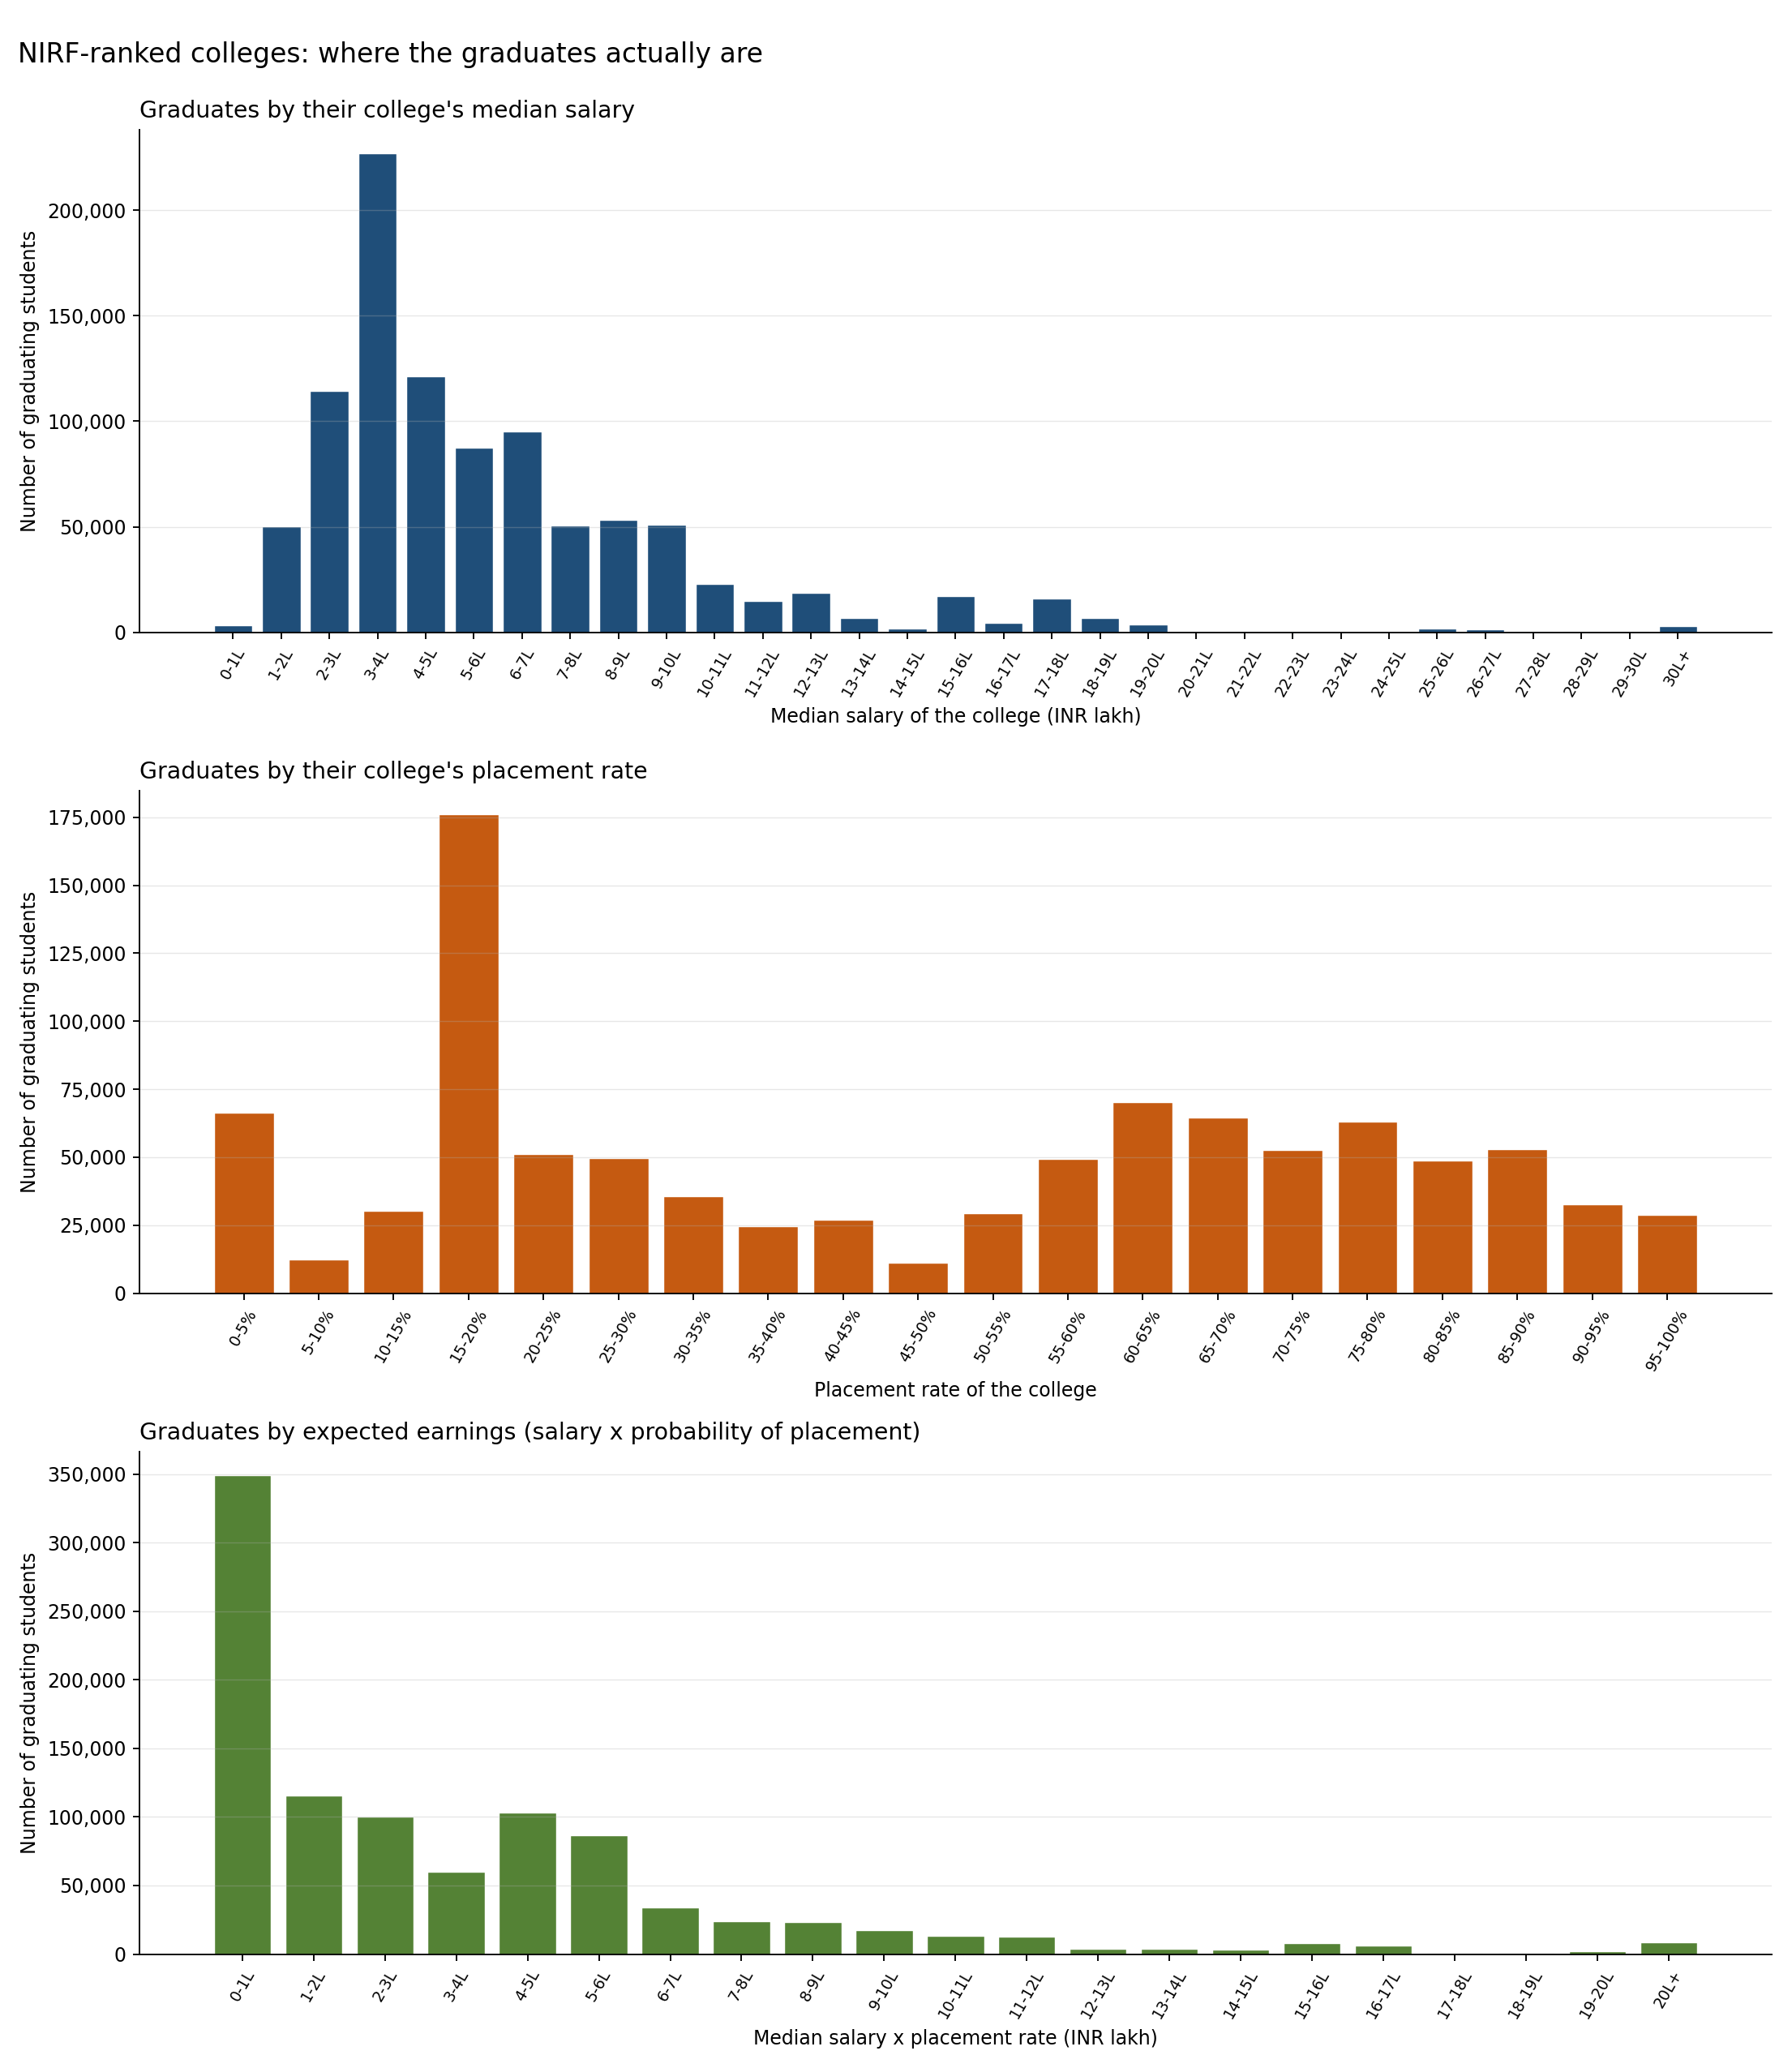
- Graduate distributions (png)

Re-upload after a rebuild:
Nothing has been re-uploaded since the entry-level rewrite. Do not upload until you have confirmed README.md, ONE_PAGER.md and the charts all carry the current numbers — a stale artefact on a public bucket outlives the correction that retired it.
# NEVER use output/* - it sweeps up alumni_outcomes_raw.csv, which is row-level# student data and must not reach a public bucket.gsutil -m cp $(ls output/* | grep -v alumni_outcomes_raw) \ ONE_PAGER.pdf nirf-college-employability.pdf \ gs://avantifellows-bq-assistant/analysis/nirf-college-employability/Rebuild
Section titled “Rebuild”Order matters — build_tier_tables.py reads the NIRF extract and both PLFS extracts.
# 1. NIRF, college x course. Range-probes ~1,350 scorecard URLs, takes a couple of minutes.bq query --use_legacy_sql=false --format=csv --max_rows=100000 \  < extract.sql > output/nirf_college_course_outcomes_latest.csvpython3 build_nirf.py
# 2. PLFS rates, on the entry-level age windowsbq query --use_legacy_sql=false --format=csv --max_rows=100000 \  < extract_plfs_fields.sql > output/plfs_outcomes_by_field.csvbq query --use_legacy_sql=false --format=csv --max_rows=100000 \  < extract_informal_wages.sql > output/plfs_what_the_others_do.csv
# 3. The tier tables, the reconciliation, the exam funnels and both chartspython3 build_tier_tables.py
# 4. Optional - the checks that defend the national pool. Neither writes anything.python3 check_pool_plausibility.pypython3 check_plfs_pool_ci.py    # queries BigQuery, bootstraps 2000 draws
build_nirf.py needs pandas, openpyxl, matplotlib, requests; the rest need pandas,
matplotlib and numpy.
Superseded, still present: overlay_plfs.py and extract_plfs.sql predate the tier tables and
are kept only because nirf_plfs_overlay.png in the workbook still comes from them. They use the
old 24-27 age window and must not be used for any headline number.
The alumni salary check is separate and optional; its raw extract is row-level student data and is gitignored:
bq query --use_legacy_sql=false --format=csv --max_rows=100000 \ < extract_alumni.sql > output/alumni_outcomes_raw.csvpython3 analyze_alumni_deflator.py # writes aggregates onlyOutputs (output/)
Section titled “Outputs (output/)”| File | What |
|---|---|
nirf_college_employability.xlsx |
The deliverable — Detail, Summary, salary and placement histograms (data + charts), college-level sheets, PLFS overlay |
nirf_college_course_outcomes_latest.csv |
Raw BigQuery extract (Detail, minus the PDF column) |
nirf_summary_by_category.csv |
Summary sheet |
nirf_salary_histogram.csv / .png |
Jobs by college median salary |
nirf_placement_histogram.csv / .png |
Colleges by placement rate |
nirf_graduate_histograms.png |
Three-panel: graduates by college salary, by placement rate, by expected earnings |
nirf_grads_by_college_salary.csv |
Panel 1 data |
nirf_grads_by_placement_rate.csv |
Panel 2 data |
nirf_grads_by_expected_earnings.csv |
Panel 3 data |
nirf_college_level.csv |
One row per physical college: grads, placed, rate, median salary, expected earnings |
nirf_plfs_overlay.csv / .png |
NIRF vs PLFS national earnings overlay |
nirf_plfs_reconciliation.csv |
Gross-up scenarios and what each does to the share |
plfs_ug_grad_earnings_by_age_cy2025.csv |
PLFS extract behind the overlay (superseded) |
tier_tables.csv / tier_outcomes.png |
Elite / ranked / unranked, per field |
reconciliation.csv |
What ranked colleges claim against national totals — the headline |
national_totals.csv |
Formal and informal work and earnings, per field, with PLFS cell sizes |
exam_funnels.csv / tier_funnels.png |
Where JEE Main and NEET UG applicants land |
plfs_outcomes_by_field.csv |
PLFS rates on the entry-level windows |
plfs_what_the_others_do.csv |
Formal, informal and self-employed median wages |
alumni_salary_deflator.csv |
Avanti alumni starting salary against what their colleges filed |
Detail — 2,958 rows = institute × ranking category × programme type, covering 818 distinct physical colleges. Carries graduating students, students placed, % placed, higher-studies selections, median salary, NIRF rank, both year columns, and a verified scorecard PDF link.
Summary — per ranking category, with a per-programme-type breakdown beneath each.
Source
Section titled “Source”avantifellows.external_data_sources.nirf_fact_master, pivoted with MAX(), joined to
nirf_fact_rankings on (institute_id, ranking_year, ranking_category).
Not nirf_fact_aggregate. That table is built by summing the raw metrics table, which contains
byte-identical duplicate rows, so 29-54 institutes per year have every figure multiplied by two or
three — including median salary, which cannot be summed. Verified against NIRF’s own published
scorecard PDFs and filed as
external_data_sources#73.
nirf_fact_strength is affected the same way; nirf_fact_rankings is clean.
Read this before using the numbers
Section titled “Read this before using the numbers”“Course wise” means programme type, not branch. NIRF publishes UG [4 Years Program(s)],
PG [2 Year Program(s)] and so on. There is no CSE-vs-Mech split anywhere in the NIRF tables.
Branch-level questions need JoSAA cutoffs or AICTE intake instead.
Nursing is not in our copy. The categories present are Engineering, University, College, Overall, Pharmacy, Management, Medical, Dental, Law, Research / Research Institutions, Architecture / Architecture and Planning, Agriculture and Allied Sectors, and State Public University / Universities. NIRF ranks Nursing, Innovation and Skill Universities too, but those were never loaded into BigQuery.
Never sum across ranking categories. One physical college ranks in Engineering and
Overall and University, and each entry reports that college’s programmes — sometimes with
identical numbers, sometimes with the Overall entry aggregating departments the
category-specific one excludes. Either way a cross-category total double- or triple-counts
real students. The Summary sheet is therefore per-category with no grand total. Everything
college-level goes through dedupe_for_college_view(), which keeps exactly one row per
(college, programme type) — an exact-duplicate filter is NOT enough and understated the
overcount by 80,110 UG placements before this was fixed.
Two year axes. nirf_scorecard_year is the NIRF ranking year; data_academic_year is the
year the numbers actually describe. 2,335 rows sit on the 2025 scorecard, 190 on 2024, and 433
on 2019–2023 for colleges that dropped out of later rankings. Filter on either column if you
need a clean single year. Scorecards before 2019 carry no outcome metrics at all, which is why
this covers 818 colleges rather than the 2,444 in the raw table.
Average salary is reported two ways. Simple mean of medians, and mean weighted by students placed. They diverge sharply (Management: ₹15.4L simple vs ₹19.3L weighted) because the unweighted figure lets a 30-graduate institute outvote a 5,000-graduate one. Prefer weighted.
Median salary is per programme row, in absolute INR. Zeros and NULLs are excluded from all salary aggregates but retained in the Detail sheet.
The analysis itself lives elsewhere
Section titled “The analysis itself lives elsewhere”This file is the technical companion: how to rebuild, what each output is, and the data caveats.
The argument and every headline number are in README.md; the method, every
analytical decision and its reasoning are in METHOD.md; the one-page summary is
ONE_PAGER.md.
Earlier versions of this file duplicated the argument prose. That duplication is how stale figures survive a correction, so it has been removed rather than updated: there is now exactly one place each number is stated.
Scorecard PDF links
Section titled “Scorecard PDF links”Built as https://www.nirfindia.org/nirfpdfcdn/{year}/pdf/{segment}/{institute_id}.pdf, where
segment is NIRF’s own short category name (Architecture and Planning → Architecture,
Research Institutions → Research, State Public Universities → StatePublicUniversity).
Every URL is range-probed before being written, so the column holds verified-live links only —
2,956 of 2,958 rows resolved. The one gap is Faculty of Dental Sciences, IMS (IR-N-N-71,
Dental 2025), left blank rather than shipped as a dead link.
Note the CDN returns 404 to HEAD requests even for files that exist; only a ranged GET with a browser User-Agent gives an honest answer.