Girls in the CoEs — where the gap opens, and where it stays
Written for Vandana, 23 September 2026, on top of her “Girls’ progress in CoEs” dashboard. The question was whether female teachers make a difference, and which subject the divergence is in. Answering it properly turned into a different, more useful answer about when the gap appears and where it ends up. It covers three cohorts: the one that sat JEE in 2026, the one sitting it in 2027, and the one that has just started.
Every number here is in percentage points: points of a test’s maximum marks. A gap of −5 means girls scored 5 percentage points lower than boys. Overall is the whole paper, all three subjects together.
Short version
Section titled “Short version”- Girls arrive behind, and the tests we select on show it before Avanti does. On 10th boards girls are level with boys at the same centre. On NCST, sat before they reach us, they are about 7 points behind overall. Some of that is how seats are filled (girls’ and boys’ seats are filled from separate lists, so the girls’ list goes deeper), but the gap is there across all 20,925 JNV students who sat the engineering NCST: 6 points on average, 16 points at the top.
- The centres are doing much better with this cohort’s girls. For the cohort that sat JEE in 2026, the gap widened by 3.3 points a year. For the 2027 cohort it is closing by 1.3 a year. That’s a swing of 4.7 points a year, and it shows in every subject (Physics +4.0, Chemistry +5.2, Maths +6.7), all statistically clear. The biggest turnarounds are Cuttack, where girls went from falling behind fast to catching up, and Kurnool. Barwani is the one centre that hasn’t improved.
- They are catching up from further back. This cohort’s girls arrived further behind at every centre: about 7 points behind overall, against about 2 for the 2026 cohort. By the first term of Grade 12 both cohorts sit about 4 to 6 points behind overall and 8 to 10 behind in Physics. The 2026 cohort got there by slipping; this one by closing.
- Maths is the weakest subject for everyone; for girls the gap is widest in Physics and Maths. At JEE Main 2026 our engineering students scored lowest in Maths, girls included. Girls trailed boys at the same centre by about 6.5 percentile points in both Physics and Maths, and 1.5 in Chemistry. On our own tests the girls’ gap is deepest in Physics, and it closes in neither cohort we can follow.
- JEE 2026 bore this out. At the same centre, girls were 9 points less likely to qualify for JEE Advanced and 18 points less likely to score at the 90th percentile or above. Compare girls and boys who were at the same level on our Grade 12 tests and the top-end gap all but disappears: JEE showed the gap our tests had already measured, not a new one.
- The female-teacher question can’t be answered with the data we hold. Most teachers on today’s roster weren’t there for most of the tests, and the school’s own teachers aren’t recorded at all.
How the gap is measured here, and why it changed
Section titled “How the gap is measured here, and why it changed”The dashboard compares each centre’s first three tests with its last three. That has two problems.
- Three tests carry a lot of luck. Who was absent, which chapters came up, a few lucky guesses. A centre that looks worst on its first three tests is partly there by bad luck, and bad luck doesn’t repeat, so it drifts back and looks as if it improved. The same happens in reverse.
- The other 10 to 30 tests are thrown away. The 2027 cohort has sat a median of 16 tests per subject.
This note uses a growth model instead, which is the standard approach in education research:
- Every student’s score on every test goes in, measured against the average of every CoE student who sat that paper, so a hard paper counts the same as an easy one. A score of −5 means 5 percentage points below that paper’s average.
- Each student gets their own line: where they started and how fast they moved. Girls’ lines are then compared with boys’ lines at the same centre, among students with the same 10th marks. Each centre gets its own starting level and its own trend, so a girls-only or boys-only centre can’t tilt the comparison. Because each girl is compared with herself over time, it doesn’t matter which girls happened to sit which test.
- Centres with few girls are pulled toward the network average. A centre with eight girls can’t top the list by chance. It only stands out if its difference is larger than its own noise.
The full method, with the model written out, the checks run and what it can’t do, is in the methodology note.
1. Before Avanti: level on boards, behind on NCST
Section titled “1. Before Avanti: level on boards, behind on NCST”The 2028 cohort (Grade 11 now) is the one where all three measures exist for the same students: 727 CoE students, 340 of them girls, with verified 10th board marks, a linked NCST 2026 score, and their first three months of Avanti tests. Gaps are girls minus boys at the same centre.
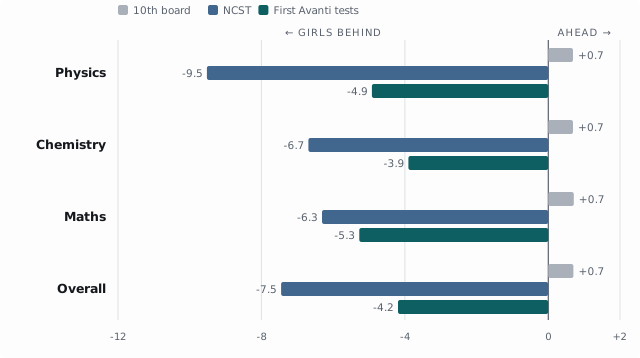
2028 cohort, 727 students with all three scores. Percentage points of each test’s maximum marks, girls minus boys at the same centre; the 10th-board bars use science marks for Physics and Chemistry and the average of maths and science for Overall.
| Gap, girls minus boys (percentage points) | Physics | Chemistry | Maths | Overall |
|---|---|---|---|---|
| 10th board marks (Mar 2026) | +0.7 | +0.7 | +0.7 | +0.7 |
| NCST, share of the maximum marks (Jan–Mar 2026) | −9.5 | −6.7 | −6.3 | −7.5 |
| First Avanti tests (Jun–Sep 2026) | −4.9 | −3.9 | −5.3 | −4.2 |
The 10th-board row uses science marks for Physics and Chemistry and the average of maths and science for Overall. The board gaps are within noise; the NCST and Avanti gaps are not.
Boards say girls and boys arrive level. NCST, a JEE-style test with negative marking, says girls arrive clearly behind. So the gap is not something that opens in the first months at Avanti. It is already there, and 10th boards don’t see it. (The three tests spread students differently, so a point on one isn’t worth exactly a point on another. The direction is what matters: level, then behind.)
Part of this is how seats are filled. The selection engine fills girls’ and boys’ seats separately, each from its own NCST-ranked list, and flags any centre where girls are under half of those selected (see coe-selection methodology, section 5). Girls are about a third of engineering NCST candidates, so to fill half the seats the girls’ list has to go deeper. At mixed centres the median admitted girl scored 31% of the NCST maximum; the median boy, 39%.
But it isn’t only selection. Across all 20,925 JNV students who sat the engineering NCST in 2026, admitted or not, girls averaged 15.9% of the maximum marks and boys 21.9%, with the same self-reported 10th marks. The gap widens toward the top, where we select: at the 90th percentile it is 34% for girls against 50% for boys.
On NCST, girls both skip more questions (26% vs 23%) and get fewer right when they answer (62% vs 70%). So it’s mostly a knowledge gap, with some extra caution under negative marking.
Does NCST explain the early gap?
Section titled “Does NCST explain the early gap?”Mostly not. Comparing girls with boys who had the same NCST score and the same 10th marks, a gap of about 3.5 to 5.5 points remains in the first Avanti tests:
| Early Avanti gap (percentage points), girls vs boys with… | Physics | Chemistry | Maths | Overall |
|---|---|---|---|---|
| no adjustment (same centre) | −4.9 | −3.9 | −5.3 | −4.2 |
| the same NCST score | −3.6 to −4.4 | −3.0 to −3.5 | −4.2 to −5.3 | −2.8 |
| the same NCST and 10th marks | −4.5 to −4.9 | −3.8 to −4.2 | −4.9 to −5.5 | −3.5 |
Subject ranges are across different ways of controlling for the score (straight line, curve, deciles, dropping the range where girls and boys don’t overlap). All are statistically clear.
The reason NCST explains so little is that it predicts how admitted students do at Avanti only weakly, less well than their 10th marks do. The coe-selection analysis reached the same conclusion about NCST and JEE outcomes. So the remaining gap is “among students who looked the same on NCST and boards”, which is not the same as “among students who arrived equally ready”. This data can’t separate prior preparation from ability. It does show the gap predates Avanti.
2. The 2027 cohort: Chemistry closes, Physics doesn’t
Section titled “2. The 2027 cohort: Chemistry closes, Physics doesn’t”The 2027 cohort (Grade 12 now) has 703 students, 308 girls, with tests from July 2025 to September 2026. NCST can’t be linked for this cohort (the 2025 file carries no date of birth or father’s name to match on), so the baseline is 10th marks.
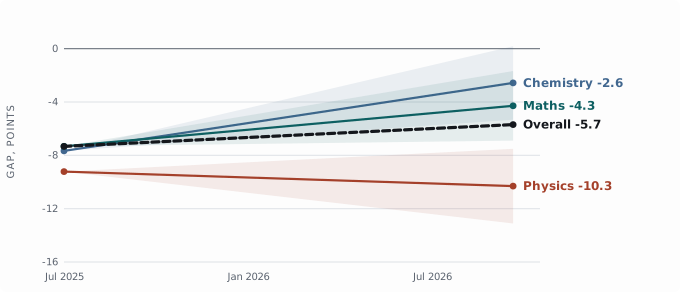
2027 cohort, 703 students (308 girls), girls vs boys with the same 10th marks at the same centre, percentage points. Lines are the growth model’s estimate; the shaded fans show the 95% range of each subject’s change; Overall is dashed.
| Gap at the first tests | Change per year | Likely range of the change | |
|---|---|---|---|
| Physics | −9.2 (−7.6 to −10.8) | −0.9 | −3.2 to +1.4 |
| Chemistry | −7.7 (−5.8 to −9.5) | +4.2 | +1.9 to +6.4 |
| Maths | −7.3 (−5.5 to −9.1) | +2.5 | +0.4 to +4.6 |
| Overall | −7.3 (−5.9 to −8.8) | +1.3 | −0.4 to +3.1 |
Percentage points, girls vs boys with the same 10th marks at the same centre. Ranges are 95% confidence intervals.
After 14 months that leaves girls about 10 points behind in Physics, 3 in Chemistry, 4 in Maths and 6 overall. Chemistry is closing clearly. Physics isn’t closing at all. Maths and Overall are moving in the right direction but can’t yet be called.
One caution on Maths. The earliest papers were very hard: in Physics and Maths a third or more of students scored under 10%. Later papers are easier, and in Chemistry and Maths they spread students out less, which on its own shrinks a gap measured in points. Measured against how spread out each paper’s scores are, Chemistry still closes clearly, but most of the Maths closing disappears.
3. The 2026 cohort: what happened
Section titled “3. The 2026 cohort: what happened”The cohort that sat JEE in 2026 is the only one we can follow all the way through: 462 students, 185 girls, tests from July 2024 to April 2026, then JEE Main.
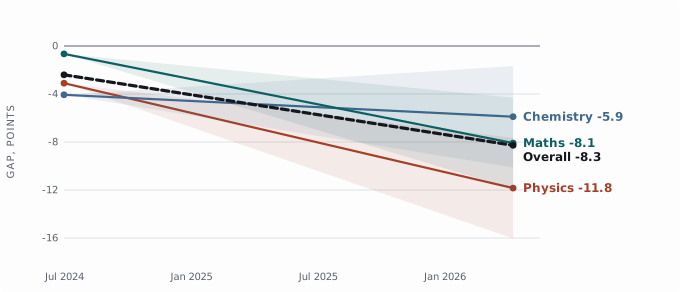
2026 cohort, 462 students (185 girls), girls vs boys with the same 10th marks at the same centre, percentage points. Lines are the growth model’s estimate; the shaded fans show the 95% range of each subject’s change; Overall is dashed.
| Gap at the first tests | Change per year | Likely range of the change | |
|---|---|---|---|
| Physics | −3.1 (−0.5 to −5.7) | −4.9 | −7.3 to −2.6 |
| Chemistry | −4.1 (−1.0 to −7.1) | −1.0 | −3.4 to +1.4 |
| Maths | −0.7 (+1.7 to −3.0) | −4.2 | −6.4 to −2.1 |
| Overall | −2.4 (−0.1 to −4.7) | −3.3 | −5.2 to −1.4 |
This cohort started much closer than the 2027 cohort did (2 points behind overall rather than 7, and level in Maths) and then slipped: the gap widened in Physics and Maths and overall, and held steady in Chemistry. The widening holds with 10th marks in deciles and when only mixed centres are used (Physics −3.2 to −5.0 a year, Maths −3.8 to −4.2, Overall −2.3 to −3.4), and it survives when measured against each paper’s spread, at about half to two-thirds the size.
The same centres, stage by stage
Section titled “The same centres, stage by stage”Two things could make the cohorts look different when they aren’t: different centres, and a straight-line model forced onto a path that isn’t straight. So the chart below compares the gap at each half-year of the course, for both cohorts, on the same six centres (Adilabad, Barwani, Chandigarh, Cuttack, Hassan, Kurnool), the ones with girls and boys tested at every stage in both.
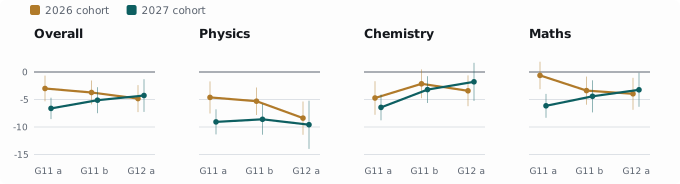
Gap at each half-year of the course: G11 a is July to December of Grade 11, G11 b January to June, G12 a July to December of Grade 12 (July to September so far for the 2027 cohort). Girls vs boys with the same 10th marks at the same centre, percentage points, with 95% ranges. Centres: Adilabad, Barwani, Chandigarh, Cuttack, Hassan, Kurnool.
| Overall gap (percentage points) | G11 Jul–Dec | G11 Jan–Jun | G12 Jul–Dec |
|---|---|---|---|
| 2026 cohort | −3.0 | −3.7 | −4.8 |
| 2027 cohort | −6.6 | −5.1 | −4.3 |
On the same centres the story holds, and it is smaller and clearer. The 2026 cohort slipped from 3 to 5 points behind; the 2027 cohort closed from 7 to 4. By the first term of Grade 12 the two sit in nearly the same place, overall and in Physics (−8.4 and −9.6).
JEE Main 2026
Section titled “JEE Main 2026”396 of the cohort’s 397 engineering students sat JEE Main 2026, 122 of them girls.
| Girls | Boys | Gap at the same centre | |
|---|---|---|---|
| Qualified for JEE Advanced | 83% | 92% | −9.3 (−1.4 to −17.1) |
| 90th percentile or above | 39% | 67% | −17.9 (−6.8 to −29.0) |
Among girls and boys who were at the same level on our Grade 12 tests (July to December 2025), the qualification gap falls to −5.1 and the top-end gap to −2.2, both within noise. So JEE didn’t add a new gap; it showed the one our tests had already measured. That also means the Grade 12 internal tests are a reliable early warning for exactly this.
By subject
Section titled “By subject”| JEE Main 2026 percentile | Physics | Chemistry | Maths |
|---|---|---|---|
| Everyone, average | 86.5 | 83.5 | 78.3 |
| Share below the 70th percentile | 13% | 17% | 27% |
| Girls, average | 80.3 | 80.0 | 71.1 |
| Girls minus boys, same centre | −6.7 | −1.5 | −6.5 |
This answers two different questions, and they have different answers.
- Where is everyone weakest? Maths. It has the lowest average and the most students below the 70th percentile, and it is girls’ weakest subject too. Our internal Maths papers have the lowest averages of the three as well.
- Where do girls trail boys most? At JEE, Physics and Maths about equally, with Chemistry close to level. On our internal tests the gap is deepest and most persistent in Physics: by the first term of Grade 12, at the same six centres, girls are 8 to 10 points behind in Physics against 3 to 4 in Maths. JEE percentiles and our percentage points are different scales, so compare the pattern, not the sizes.
The girls-minus-boys row compares each student with their own centre’s average, among the 323 students at centres with both girls and boys.
4. Centre by centre: 2026 against 2027
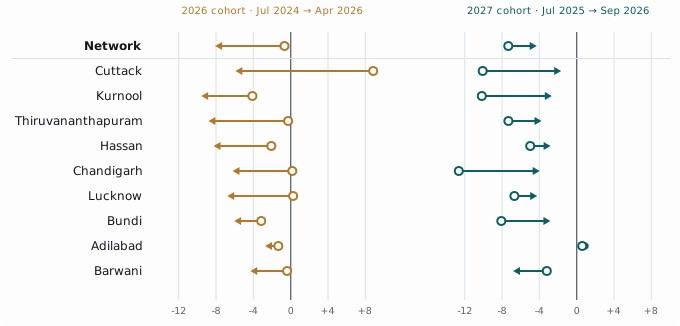
Section titled “4. Centre by centre: 2026 against 2027”Nine centres have girls and boys in both cohorts. In each chart below, every centre has two arrows: the 2026 cohort on the left and the 2027 cohort on the right, on the same scale. Each arrow runs from the gap at that cohort’s first tests (open circle) to the gap at its latest tests (arrowhead): girls vs boys with the same 10th marks, in percentage points. An arrow pointing right, towards zero, means girls catching up; pointing left, falling further behind. Overall first, then each subject, with the centres in the same order throughout. Each centre’s figures are pulled toward its cohort’s network by its own uncertainty.
Overall
Section titled “Overall”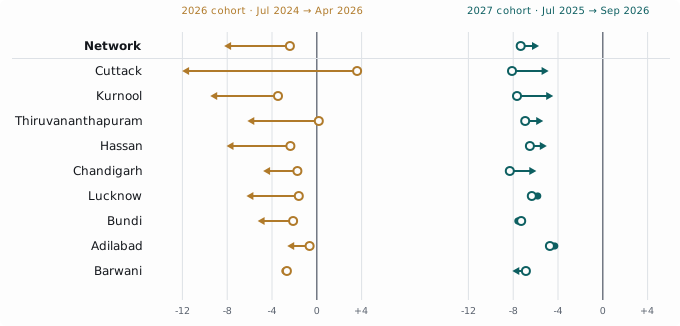
Physics
Section titled “Physics”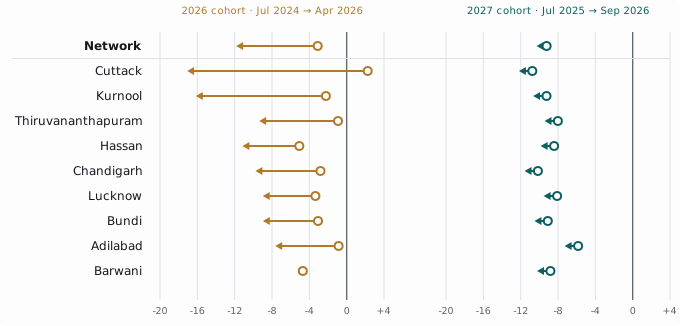
Chemistry
Section titled “Chemistry”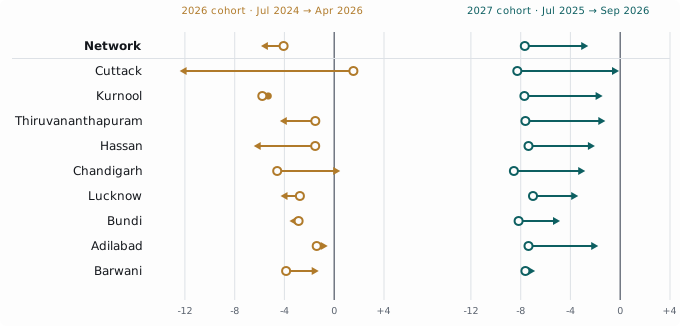
The Overall figures, centre by centre:
| Centre | Girls (2026 / 2027) | Gap at first tests, 2026 | Gap at first tests, 2027 | Change in gap per year, 2026 | Change in gap per year, 2027 |
|---|---|---|---|---|---|
| Network | 185 / 308 | -2.4 | -7.3 | -3.3 | +1.3 |
| Cuttack | 7 / 9 | +3.6 | -8.1 | -8.8 | +2.7 |
| Kurnool | 10 / 11 | -3.5 | -7.7 | -3.4 | +2.6 |
| Thiruvananthapuram | 8 / 11 | +0.2 | -6.9 | -3.6 | +1.3 |
| Hassan | 9 / 10 | -2.4 | -6.5 | -3.2 | +1.2 |
| Chandigarh | 25 / 29 | -1.7 | -8.3 | -1.7 | +1.9 |
| Lucknow | 18 / 14 | -1.6 | -6.3 | -2.6 | +0.4 |
| Bundi | 11 / 10 | -2.1 | -7.3 | -1.8 | -0.2 |
| Adilabad | 8 / 8 | -0.6 | -4.7 | -1.1 | +0.3 |
| Barwani | 12 / 9 | -2.7 | -6.9 | -0.1 | -1.0 |
Gap at first tests: how far girls were behind boys with the same 10th marks when the cohort started, in percentage points. Change in gap per year: how many percentage points that gap moved each year after that. Positive means girls catching up (the gap shrinking); negative means falling further behind. So in the 2026 cohort Cuttack’s girls started 3.6 points ahead and lost 8.8 points a year; in the 2027 cohort they started 8.1 points behind and are gaining 2.7 a year.
Two things stand out.
Every centre’s girls started further behind in 2027, by 4 to 12 points. This isn’t one or two centres; it’s the whole cohort. Something about who arrived, or how ready they were, was different. The data doesn’t say what.
And almost everywhere, the gap is now moving the right way. At eight of the nine centres the 2027 trend is better than the 2026 one. Those centre figures are pulled toward each cohort’s network, so they carry some of the network’s improvement by construction. Taking each centre’s own data alone, with nothing pulled in, the change is clear at two centres:
- Cuttack: from girls falling behind by 14 points a year to catching up by 8. The biggest turnaround in the network.
- Kurnool: from −4 a year to +9.
Barwani went the other way (+2 a year to −6); that’s within noise, but it’s the one centre that didn’t improve. Bundi and Lucknow can’t be compared fairly: their 2026 trends rest on Grade 12 tests alone.
What this isn’t: proof that the centres caused it. Girls who start further behind have more room to catch up, and the 2027 cohort hasn’t yet reached the January-to-April stretch of Grade 12. But a swing this large, in every subject and at almost every centre, is hard to put down to chance.
5. Notes on individual centres
Section titled “5. Notes on individual centres”2027 cohort. The starting gap is nearly the same everywhere in Chemistry, between −7 and −9 at every centre. It varies more in Maths, from about zero at Adilabad to −13 at Chandigarh. How the gap moves can’t be told apart between centres: each centre’s own estimate of its trend is uncertain by 5 to 17 points a year either way, because most centres have 8 to 18 girls, and no centre differs from the network trend in any subject. In Physics, centres show no measurable difference at all. Barwani is at the bottom in Chemistry and Maths; with 9 girls that is within noise, but it is the centre to watch. Five centres (Durgapur, Kolhapur, Mahisagar, Medak and Palghar) have girls and boys only in this cohort, so they aren’t in the charts above; none of them differs from the network either.
2026 cohort. Cuttack is the one centre that stands out, in any cohort. Its girls (only 7) started ahead of boys, overall and in every subject, and fell behind at 8 to 11 points a year, ending about 10 points behind overall. That’s clearly different from the network in Physics, Chemistry and Overall. Elsewhere the centres moved with the network. Bundi and Lucknow have no Grade 11 tests on record for this cohort, so their 2026 figures rest on Grade 12 alone.
2028 cohort. Ujjain 2 stands out: after three tests its girls are 17 to 20 points behind in all three subjects. That’s too few tests for a verdict, but the consistency across subjects makes it the one opening gap worth a visit now.
6. Female teachers
Section titled “6. Female teachers”This can’t be answered with the data we hold, for three reasons.
- The roster is almost entirely new. Of 122 CoE teaching staff on the FY27 roster, 64% joined after April 2025, and 40% joined this academic year. Median time in post is 7.8 months; for female teachers, 5.1 months against 12.5 for male teachers. Today’s roster mostly describes people who weren’t there for most of the tests.
- Where the timing does line up, female teachers are too rare. The new cohort’s three-month window is covered by 71% of current staff, but only 6 of 60 centre-subjects had a female teacher in post throughout. The difference was 1.2 points (p = 0.73): nothing to see, and nothing to see it with.
- The school’s own teachers aren’t recorded. CoE students are also taught by the JNV’s faculty, and nothing in our data says who they are, what they teach or their gender.
Answering it would need teacher-to-batch history (fact_teacher_session_attendance may hold enough
to reconstruct it) and some record of school staff.
What this points to
Section titled “What this points to”- The gap is set at entry, network-wide. That points to the first term of Grade 11, and to selection: girls admitted from deeper in the list start further behind, so they are the group a first-term bridge would reach.
- Maths is the weakest subject for everyone, and Physics is where girls’ gap never closes. At JEE, girls trailed boys by as much in Maths as in Physics.
- Something changed for the better between the two cohorts. It’s worth finding out what Cuttack and Kurnool did differently this time, and why Barwani didn’t move.
- Grade 12 is where the 2026 cohort slipped. The 2027 cohort is now at the same point. Its January-to-April tests will show whether it holds or slips the same way.
Suggested changes to the dashboard
Section titled “Suggested changes to the dashboard”- Replace Start / Now / Change with Level and Trend, each fitted through every test, with a margin of error. Call a trend only when it clears its margin.
- Pull small centres toward the network average so a centre with eight girls can’t top the list by chance.
- Show an adjusted level alongside the raw one: girls vs boys with the same 10th marks, and NCST where it’s linked. It answers “is the gap where it should be?”, which change alone can’t.
- Show the new cohort’s level from its first tests rather than “Not enough data”. That’s when it’s most useful.
Limits
Section titled “Limits”- Students are attributed to their current centre; anyone who transferred carries their earlier results with them.
- Cohorts are identified by students’ current grade. Students who left the 2027 cohort (15 girls, 8 boys, about 4% of girls) drop out entirely, which barely moves the results.
- In the 2026 cohort, Bundi and Lucknow have no Grade 11 tests on record, and January to April of Grade 12 is thinly tested (several centres tested one to four students then). The stage comparison leaves both out.
- NCST is linked for 69% of the 2028 cohort (name and date-of-birth matching) and not at all for the 2026 or 2027 cohorts in this analysis.
- JEE outcomes cover the engineering stream only. Biology and the medical stream are left out throughout: too few tests for a stable model.
- The 2028 cohort has only three months of tests, so for it this note reports the starting gap only.
Changes from the earlier drafts
Section titled “Changes from the earlier drafts”- Mixed cohorts. An earlier version compared each centre’s first tests with its last without splitting by cohort, so “start” and “now” were often different students. That produced three wrong claims: that Cuttack was diverging in the current cohort (it was the new cohort arriving far behind), that start position predicts 62% of movement (it’s closer to 23% within a cohort), and that centre explains three-quarters of the movement.
- Mixed units. A later draft mixed standard deviations with points. Everything is now in percentage points.
- Subjects. An earlier version said “Physics is the subject answer”. That holds for the girls’ gap on our internal tests, but at JEE the girls’ Maths gap was as large, and Maths is the weakest subject for everyone.
- Shared time trend. The previous version gave each centre its own starting level but one shared time trend. That let girls at girls-only centres and boys at boys-only centres into the comparison of how fast the gap moves. With each centre given its own trend, the 2027 figures moved: Physics from +0.5 to −0.9 a year, Chemistry from +2.9 to +4.2, Maths from +3.3 to +2.5. The same fix is what shows the 2026 cohort’s widening clearly.
Reproducing
Section titled “Reproducing”bq query --use_legacy_sql=false --format=csv --max_rows=2000000 --quiet < extract_panel.sql > panel.csvuv run --with pandas --with statsmodels python growth_model.py panel.csvuv run --with pandas --with statsmodels python stage_gaps.py panel.csvuv run --with pandas --with statsmodels python robustness.pybq query --use_legacy_sql=false --format=csv --quiet < jee_check.sql > jee2026.csvbq query --use_legacy_sql=false --format=csv --quiet < jee_subjects.sqluv run --with pandas --with statsmodels python jee_check.py panel.csv jee2026.csvpanel.csv is one row per student per test per subject, keyed by student id, so it stays out of
git (the repo ignores *.csv). The scripts write their result tables beside it;
centre_growth.json and stage_gaps.json are the aggregates the charts read.