Two Gates, Not One
Two Gates, Not One: How Merit and Money Jointly Ration India’s Engineering and Medical Seats
Section titled “Two Gates, Not One: How Merit and Money Jointly Ration India’s Engineering and Medical Seats”A capacity-vs-access analysis of MBBS, BDS, and NIRF-ranked engineering seats
Section titled “A capacity-vs-access analysis of MBBS, BDS, and NIRF-ranked engineering seats”Created 26 July 2026 · Avanti Fellows · Draft v1
About this paper. This is an internal analysis by Avanti Fellows, shared for transparency. It has not been peer-reviewed. It was prepared with substantial help from AI tools (Anthropic’s Claude), which wrote much of the code and drafted much of the text under the direction of Avanti staff. The numbers are produced by code from the underlying data, and the sources and methods are documented so they can be checked, but errors are possible. Read the findings as preliminary, and contact Avanti Fellows before citing them.
Abstract
Section titled “Abstract”India’s public debate about higher-education access is conducted in the language of capacity — how many MBBS seats, how many engineering seats. That framing is misleading. A seat is rationed twice: once on merit (an entrance-exam percentile floor) and once on money (a fee the family must fund). In the Indian seat design these two gates are deliberately anti-correlated — the cheapest seats carry the highest merit bars, and the seats with no merit bar carry the highest fees. So the headline capacity number systematically overstates what any given student can actually reach.
We build a college-by-college model of ~398,000 seats (all MBBS and BDS seats; NIRF-ranked engineering) that splits each college into its true regulatory buckets — after classifying every one of the 608 non-government medical colleges as a deemed university (no government-rate quota) or a private self-financing college, institution by institution, with a source per determination — attaches a fee and a merit floor to each, and computes the capacity reachable by a student at every point on the merit × budget grid. The result: only ~39% of this capacity is government-rate (affordability-independent) seating, and reaching even that requires top-percentile merit; 10–19% of capacity is management/NRI seating reachable only above a ~₹15 L/yr budget that fewer than ~2% of aspirant families can sustain. A low-income student below the ~98th percentile can reach essentially zero seats. The binding constraint flips across the population, and the squeezed middle — decent merit, modest means — reaches the least capacity relative to its size.
1. The two-gate framework
Section titled “1. The two-gate framework”For each seat bucket b, a student reaches it only if
merit_percentile ≥ cutoff_floor(b)ANDfundable_budget ≥ fee(b).
Accessible capacity for a student is the sum of seats across every bucket where both conditions hold. Aggregated over the student population, this yields a capacity-vs-access curve rather than a single capacity count.
The consequence to expect — and which the model confirms — is that the binding constraint flips: for a high-merit / low-budget student, money binds (they clear cutoffs but cannot fund management seats); for a low-merit / high-budget student, merit is a non-issue (they buy management or NRI seats); and the mid/mid cohort is squeezed from both sides.
2. Data and method
Section titled “2. Data and method”Capacity. MBBS from the NMC 2024-25 seat matrix (118,190 seats, 780 colleges); BDS from Avanti’s College DB (28,016 seats, 330 colleges — 80% private); engineering from NIRF-ranked institutes’ first-year intake (~252,000 seats). Total modelled: 398,189 seats.
Bucket split. Each college’s sanctioned intake is exploded into regulatory buckets by the rules in a single documented config: government colleges → 15% All India Quota + 85% state quota; private-state → 50% government-rate (merit-first, per the NMC-2022 rule) + 35% management + 15% NRI; deemed → 85% management + 15% NRI. Engineering management seats carry no competitive-exam floor (Class-12 eligibility only), so their merit gate is disabled and only money gates them — the single biggest medicine-vs-engineering difference.
Gates. Fees are indicative tier bands (no systematic per-college fee dataset
exists), validated at the accessible end against Gujarat’s real ACPC fees.
Affordability budget-tier shares are grounded in the PLFS consumption
distribution and reported at two calibrations. Every headline number is computed
across fee (low/high) × cutoff (tight/loose) × affordability
(conservative/generous) and reported as a band, not a point. Full method,
provenance, and softnesses in README.md.
3. Findings
Section titled “3. Findings”3.1 Access collapses in the low-budget column
Section titled “3.1 Access collapses in the low-budget column”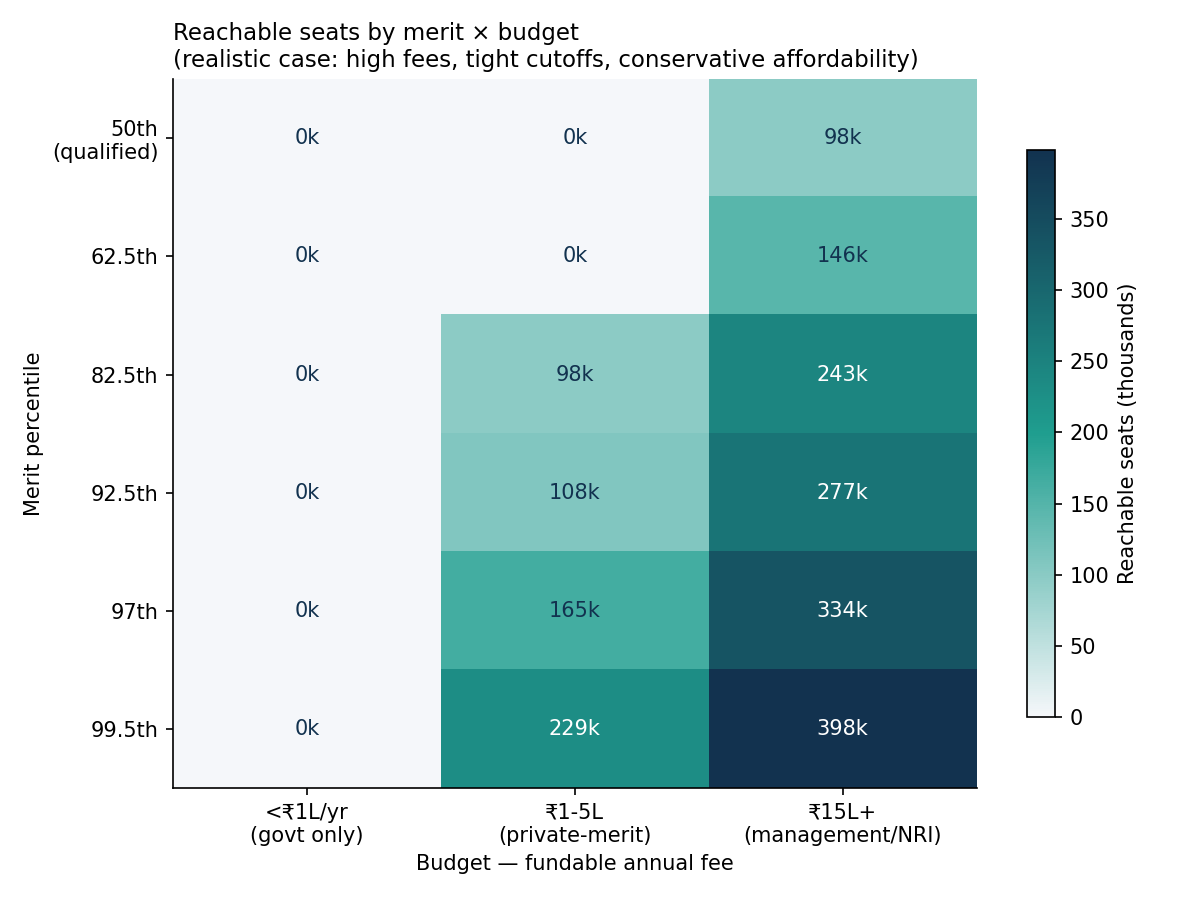
In the realistic case (high fees, tight cutoffs, conservative affordability), the entire T0 budget column (< ₹1 L/yr) is zero except at the 99.5th percentile, where a student reaches ~64,000 government seats. A student below roughly the 98th percentile with a low-income budget reaches no seats at all. Capacity opens up far more by moving right (money) than up (merit): at the 82.5th percentile, reachable seats go from 0 (T0) → 98k (T1) → 166k (T2) → 236k (T3). Merit buys little without money.
3.2 Money shifts the access curve more than merit does
Section titled “3.2 Money shifts the access curve more than merit does”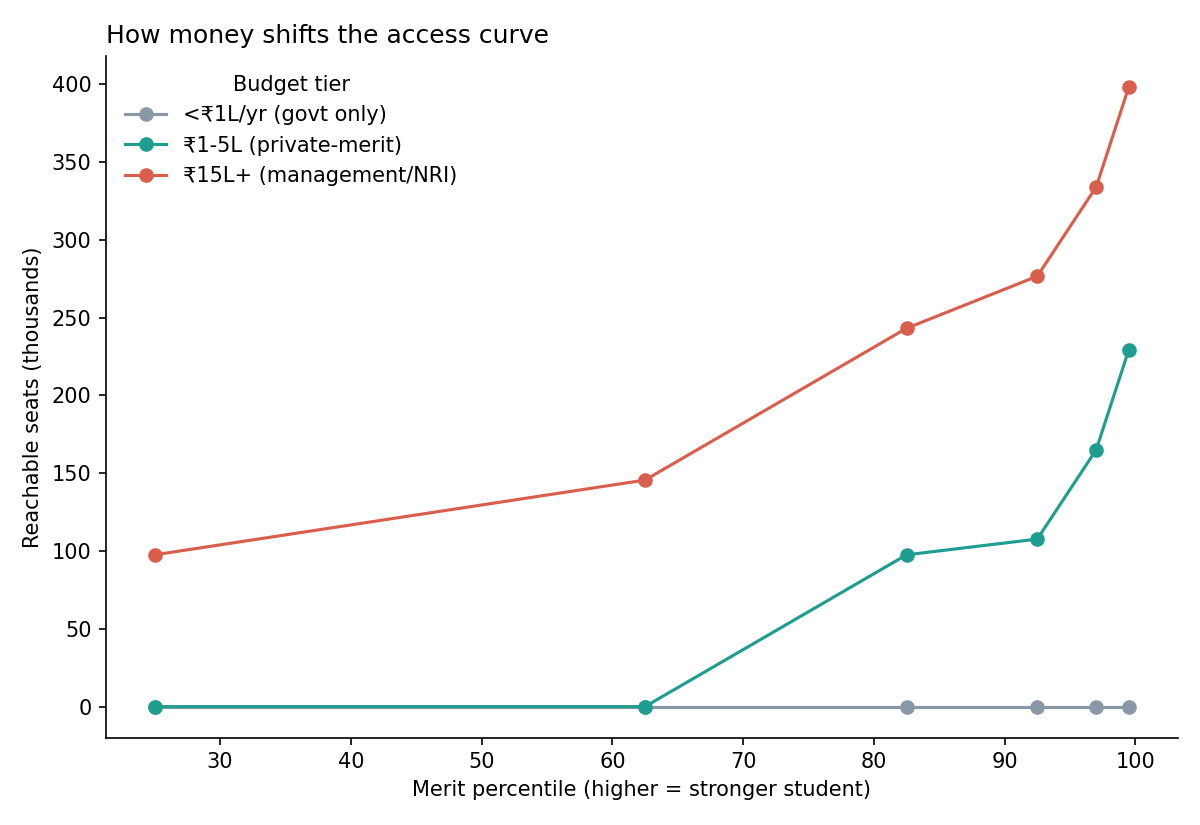
Plotting cumulative reachable seats against merit for each budget tier: the curves are stacked by budget, and the vertical gap between them (the money effect) is large at every merit level. A budget increase shifts the reachable-capacity curve left by more than a large merit increase shifts it up.
3.3 The inequality of access
Section titled “3.3 The inequality of access”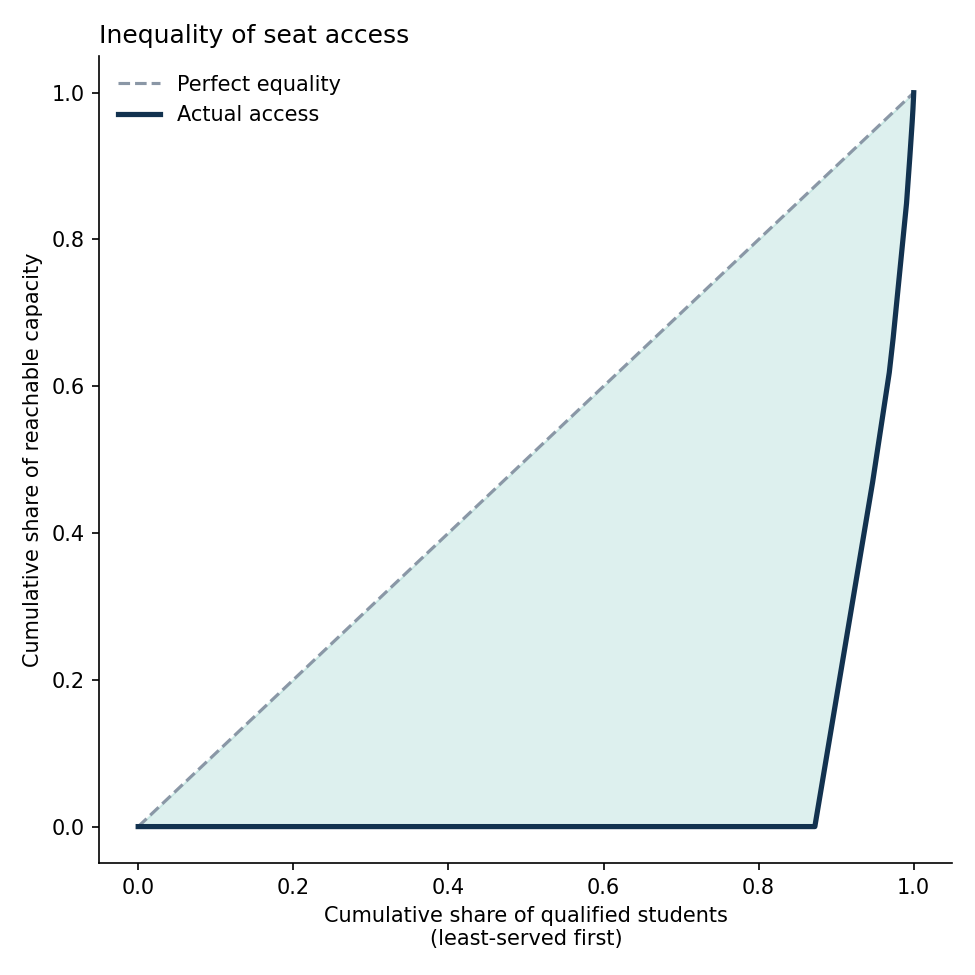
Ordering students least-served first and plotting cumulative reachable capacity against cumulative student share yields a curve that sits far below the diagonal: capacity is concentrated among a small share of students — those who clear both gates. The area between the curve and the diagonal is the inequality-of-access measure.
3.4 Headline statistics
Section titled “3.4 Headline statistics”| Statistic | Value |
|---|---|
| Total modelled seats | 398,189 |
| Government-rate capacity (merit-gated, affordability-independent) | 162,373 (40.8%) |
| “Affluent-only” capacity (reachable only above ~₹15 L/yr) | 41,000–70,000 (10.4%–17.6%) |
| Share of qualifiers who can reach ≥1 seat | ~21% (pessimistic) to ~83% (optimistic) |
The government-rate 40.8% is an upper bound: it credits every private-state college with honouring the NMC 50%-government-rate rule. If genuine deemed universities (not separately identifiable in the NMC data) do not, the true government-rate share falls toward ~30% and the affluent-only share rises.
3.5 The 20-year capacity story: private became the majority-maker
Section titled “3.5 The 20-year capacity story: private became the majority-maker”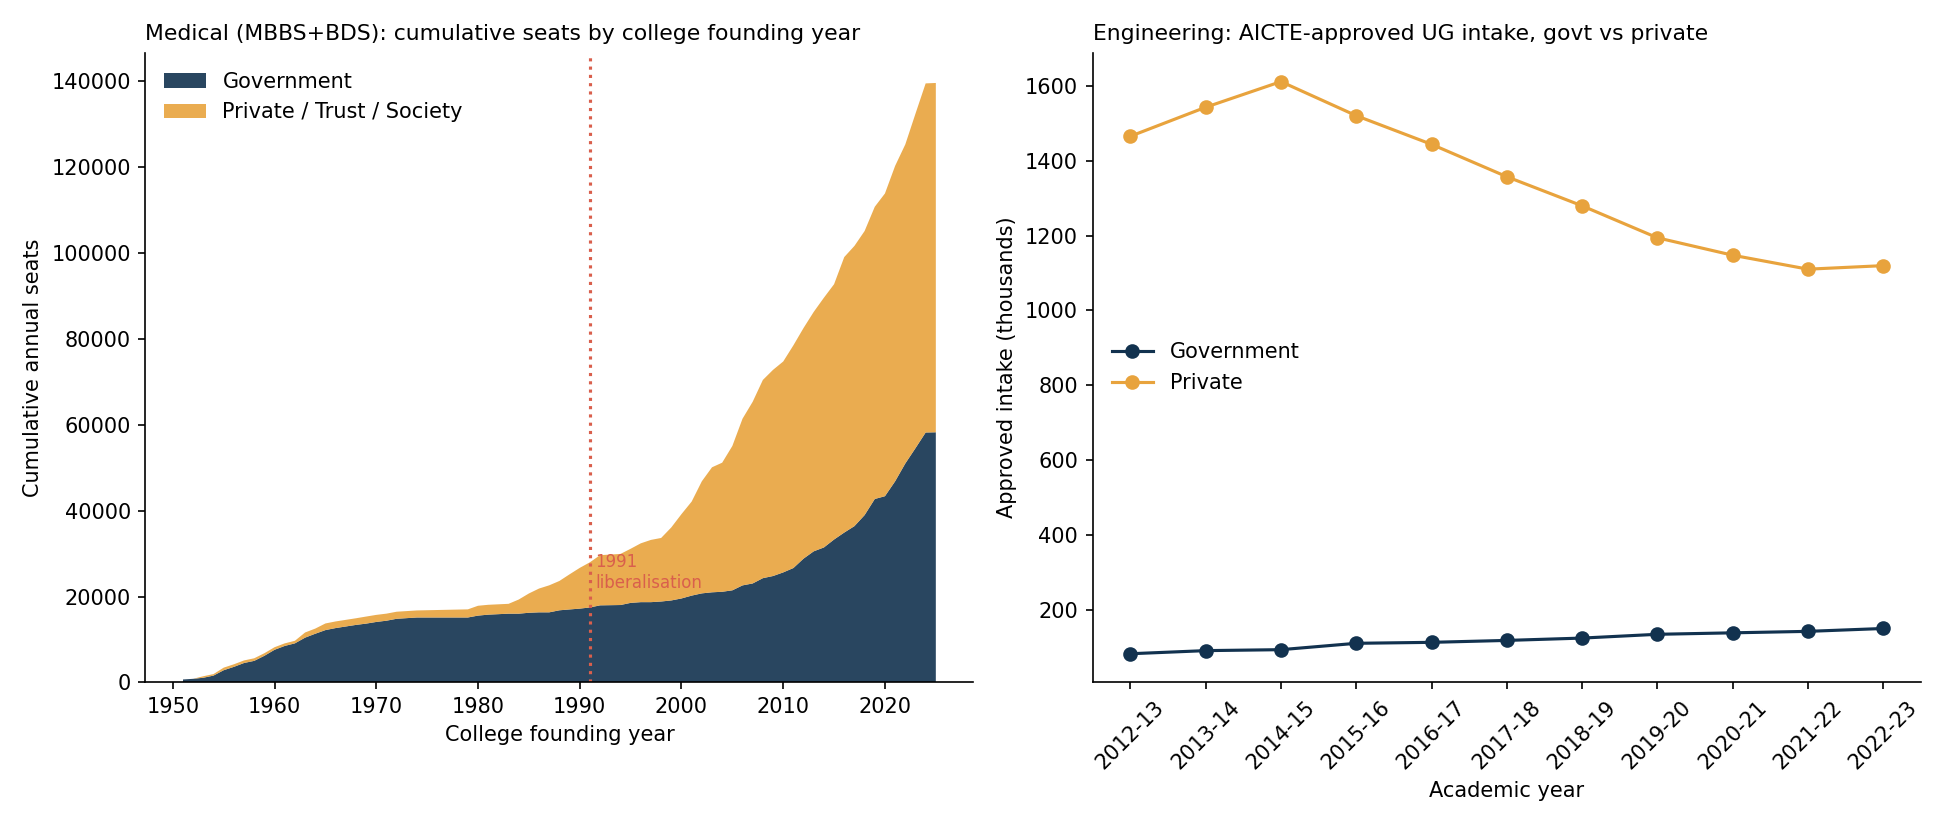
Medical capacity was almost entirely government until ~1980; after the 1991 liberalisation, private/trust/society capacity grew explosively to roughly match government by 2025 — nearly all net new medical capacity of the last three decades is private, i.e. the high-fee, affordability-gated kind. Engineering is the same story at larger scale: AICTE-approved private intake (~1.0–1.6 M) dwarfs government (~85–140 k) by roughly 10×, having peaked around 2014 before the private-college shakeout. The capacity India added is overwhelmingly the capacity that the affordability gate rations hardest.
4. Policy implication
Section titled “4. Policy implication”Counting seats — even counting government seats — overstates access, because the seats a poor high-merit student can actually reach are a thin, merit-elite slice, while the bulk of the capacity added since liberalisation sits behind the money gate. Expanding “capacity” in the abstract does not expand access; expanding government-rate, merit-gated capacity — or subsidising the money gate for high-merit low-income students — does. The squeezed middle (decent merit, modest means) is the cohort least served by the current design and the one most responsive to either lever.
5. Limitations
Section titled “5. Limitations”Fees are indicative and swept, not sourced per college; management cutoffs are
demand-clearing prices, bracketed; affordability is a modelling assumption
reported at two calibrations; deemed medical colleges are not separately
identified (government-rate share is an upper bound); engineering scope is
NIRF-ranked only, so the private long tail — and hence the affluent-only share —
is understated. Full detail in README.md.
Replication data
Section titled “Replication data”De-identified model outputs (college-level aggregates, no PII):
- exploded_buckets.csv — one row per college × seat-bucket
- reachability.csv — full merit × budget grid, all calibrations
- headline_stats.csv — punchline numbers per calibration
- bucket_summary.csv · fee_spotcheck.csv
- Figures: heatmap · access curves · lorenz · capacity trend