Showing Up Regularly

Showing Up Regularly
Regular Online Practice and JEE-Main Qualification in India’s Navodaya Schools: Early Indicators from the Lakshya Monthly Tests
About this paper. This is an internal analysis by Avanti Fellows, shared for transparency. It has not been peer-reviewed. It was prepared with substantial help from AI tools (Anthropic’s Claude), which wrote much of the code and drafted much of the text under the direction of Avanti staff. The numbers are produced by code from the underlying data, and the sources and methods are documented so they can be checked, but errors are possible. Read the findings as preliminary, and contact Avanti Fellows before citing them.
Read this paper as early indicators, not as an impact estimate. Its companion, Non-Linear Returns, compares two programmes that Avanti assigns students to. Here the “treatment” is something students choose for themselves, sitting a free monthly test, so the selection problem is harder and every finding below carries more caveats (Section 12). What the data can show is that regular practice is a strong, early and robust signal. Whether it is also a lever needs a trial.
Executive Summary
Section titled “Executive Summary”Avanti’s online programme reaches students in India’s Navodaya schools (JNVs), free government boarding schools for rural, mostly first-generation children, who are not in an intensive Centre of Excellence. Its core is Lakshya, a free platform that offers one full-length, three-hour JEE mock test a month. We linked enrolment, platform logs and JEE results for the 8,943 engineering-track students who finished Class 12 in 2026, across 564 schools, and asked: do students who practise regularly, sitting the monthly mock in more months, qualify for JEE Main more often?
Regular practice is rare. 77% of students never sat a single full-length test before JEE. 23% sat one in at least one month, 7% in two or more, and only 2.3% in three or more. Because there is one mock a month, the number of tests and the number of months are almost the same thing (99.6% of practising students sat at most one a month), so “regularity” here means how many months a student showed up.
Being an active Lakshya user goes with nearly twice the chance of qualifying. 1,858 students with Class-10 marks practised at least once before JEE (“active”). With the same marks, category and gender, an active student’s chance of qualifying is 6.5 percentage points higher [+4.7, +8.2] than an inactive student’s, on a base of 7.3%: about 1.9 times the chance. Comparing only classmates in the same school the gap is +5.1 pp, and reweighting inactive students to look like active ones gives +6.6 pp.
Students who show up more months qualify more often still. In a logistic regression that holds Class-10 marks, social category and gender fixed, each additional month of practice goes with about 1.50 times the odds of qualifying JEE Main, and the figure is the same comparing classmates in the same school (1.51). In probabilities, a student with no practice has a predicted 7.8% chance of qualifying and the same student with three months 19.7%. (Raw rates are similar: 7.0% and 22.7%.)
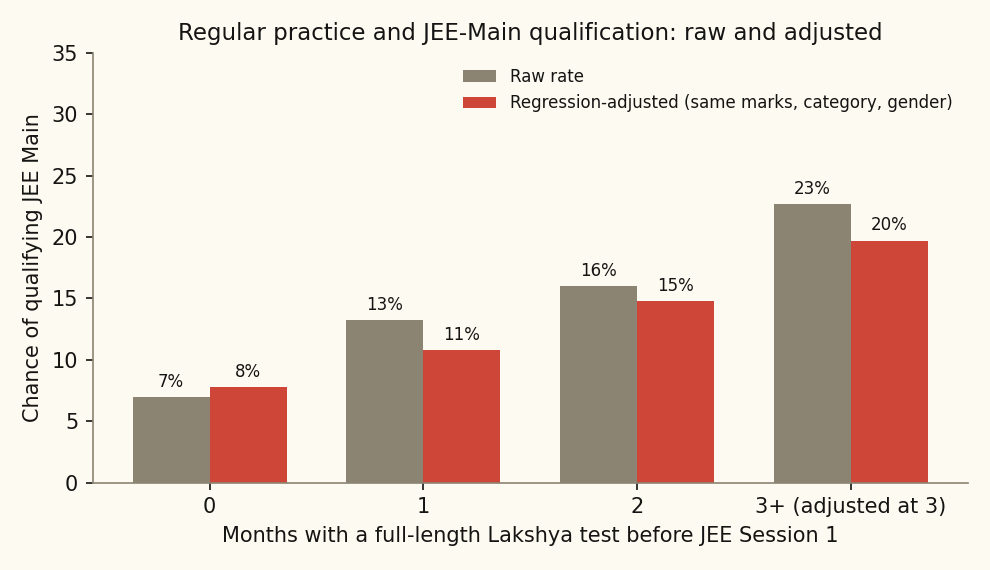
The orange bars are regression estimates: each is the average predicted chance of qualifying if every student kept their own marks, category and gender but practised for that many months. They sit close to the raw rates, so the controls change little. The within-school version (school fixed effects) gives the same odds ratio.
The signal is visible early. Practising at least once by the end of October of Class 12, three months before the exam, goes with 1.82 times the odds of qualifying in the same regression: a predicted 13.4% against 8.3% for an otherwise identical student who had not (raw rates 15.6% and 7.7%). That makes early practice a usable early indicator for a programme that wants to know, mid-year, who is on track. It is a weak screen on its own: only 24% of eventual qualifiers had practised by October, and 39% had practised at all.
Two tests are enough; scores do not add yet. The signal is established by 1 November, after two monthly tests: the odds ratio for being active is 1.89 then and 2.04 by Session 1, so waiting longer finds more active students (23% of eventual qualifiers by November, 38% by Session 1) but not a stronger signal. Combined with Class-10 marks of 80 or more, being active by November marks out 674 students who qualify at 20%, against 8% for everyone else. Lakshya scores do not sharpen this. Adding a student’s score on the platform tests leaves the model’s accuracy where it was (0.775 against 0.776), and the scores do not behave like a measure of ability yet: they are unrelated to Class-10 marks (−0.07) and cluster by school (Section 8.1). Until sittings are supervised or scores validated, the early marker is active and strong, not a high platform score.
Active users did not get measurably better at the tests themselves. Across the 628 students who sat two or more tests, their score, accuracy, attempt rate, wrong answers and time used did not improve from one sitting to the next relative to other students on the same paper (every change within ±0.07 of a standard deviation per sitting). What sets regular users apart is visible from their first sitting: they use more of the three hours and attempt more selectively. So the data show careful test-taking as something regular users bring, not something the tests visibly teach, which is one more reason to read the qualification gap as partly selection.
Strong students’ scores tell the same story. Among students with Class-10 marks of 80+, in the schools in the programme both years, active OBC, SC and ST students reached the 83rd JEE percentile (an All-India Rank of about 2.7 lakh) at 9.9 per 100 against 2.9 for their inactive classmates in 2026 (+6.3 pp adjusted). But active preparers had started ahead, did not pull further ahead between 2025 and 2026, and their share of the class did not grow (Section 9). A replication for Avanti’s online Punjab students was inconclusive.
It goes furthest with students who are already strong. Among students with Class-10 marks of 90 or above, qualification rises from 14% with no practice to 35% with three or more months; below 80 it barely moves (5% to 8%). Regular practice reinforces preparation; it does not substitute for it.
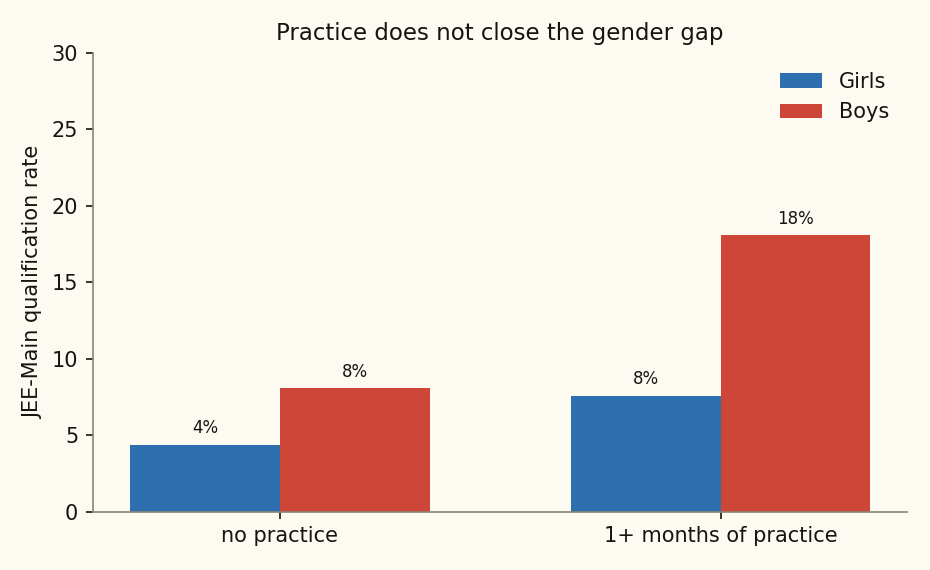
Girls are left behind, and practice does not close the gap. Girls on the engineering track qualify at 5.2% against boys’ 10.3%, and at 0.51 times boys’ odds with the same marks and category. Girls practise at least as much as boys, and practice goes with qualification for both, but the gap does not narrow.
How far to trust this. The gap is unusually well insulated for observational data: the schools are residential, so family circumstances are held roughly fixed; it holds between classmates; it holds for practice taken months before the exam; and a standard sensitivity bound says hidden selection would have to be very strong to explain it. But students choose to practise, and the most motivated students may both practise and pass. The outcome data also cannot tell a student who failed JEE from one who never sat it. So we read regular practice as a strong early indicator with a plausible causal core, and the case for a randomised test of a regular-practice push, not as proof that practice raises scores.
Showing Up Regularly: Regular Online Practice and JEE-Main Qualification
Section titled “Showing Up Regularly: Regular Online Practice and JEE-Main Qualification”1. Abstract
Section titled “1. Abstract”We examine whether regular participation in a free monthly full-length JEE practice test is associated with JEE Main qualification among uncoached students in India’s Jawahar Navodaya Vidyalaya residential schools. Linking enrolment, platform-use and exam records for the 8,943 engineering-stream students of the 2026 graduating cohort, we measure regularity as the number of calendar months in which a student completed a valid full-length sitting (120 to 360 minutes) before JEE Main Session 1. Participation is rare: 77% never practised. Each additional month of practice is associated with 1.50 times the odds of qualifying [1.37, 1.64], net of Class-10 board marks, social category and gender, and 1.51 [1.31, 1.75] with school fixed effects. Active users (any practice) have a 6.5 percentage points higher probability of qualifying than inactive students with the same marks, category and gender (+5.1 pp within school), nearly doubling a 7.3% base. Practice before November of Class 12 predicts qualification as strongly (OR 1.71), which makes it usable as an early indicator. Within active students, test-taking measures (score, accuracy, attempt rate, wrong answers, time) show no improvement across successive sittings relative to peers on the same paper. The association is strongest among students with high prior marks and does not narrow a large gender gap (female OR 0.51). An Oster bound suggests selection on unobservables would need to be roughly 18 times as strong as selection on observables to explain the result away under the conventional assumption, but the treatment is self-chosen, regularity cannot be separated from volume, and non-qualifiers cannot be split into those who sat the exam and those who did not. Two monthly tests are enough to establish the signal: by 1 November the odds ratio for being active is 1.89 [1.55, 2.32], against 2.04 by Session 1; later months add coverage, not strength. Scores on the Lakshya tests add almost nothing to activity and do not track Class-10 marks, so the early marker is being active with strong prior marks, not a high platform score. We therefore report an early indicator and a hypothesis for a trial, not an impact estimate.
2. Why regular practice
Section titled “2. Why regular practice”The cognitive-science evidence that taking tests improves later exam performance is strong and experimental (Roediger & Karpicke 2006; Karpicke & Roediger 2008; meta-analyses in Rowland 2014 and Adesope, Trevisan & Sundararajan 2017; classroom evidence in Agarwal, Bain & Chamberlain 2012), and the benefit grows with the number of retrieval episodes. A full-length mock is retrieval practice at the scale of the real exam: three hours, the real format, a real score. It also builds the exam stamina a first-generation student may never otherwise rehearse. That is the mechanism under which regular practice could be partly causal. It does not, by itself, license a causal reading of observational data.
Reviews of learning strategies rate practice testing and distributed practice as the only two “high utility” techniques of ten reviewed (Dunlosky et al. 2013; Dunlosky 2013), and a meta-analysis finds practice tests beat restudying and every other comparison condition (random-effects g = 0.70; Adesope, Trevisan & Sundararajan 2017). In a five-year classroom project with more than 1,400 middle-school students, quizzed material was still better remembered one to two months later (79% against 67%; Agarwal, Bain & Chamberlain 2012). and a meta-analysis of 839 assessments finds that for retention over six months or more, gaps of at least a month between sessions work best (Cepeda et al. 2006), roughly the rhythm of a monthly mock. In the lab, students who were tested recalled 56% of material a week later against 42% for those who restudied (Roediger & Karpicke 2006). But the field evidence on mock tests for a real entrance exam is thin and mixed: in Russia, how often teachers gave practice tests had no significant effect on the national college entrance exam, while test-specific homework did (Zakharov, Carnoy & Loyalka 2013). And Cepeda et al. themselves warn that most of their evidence comes from single-session lab studies.
The policy reason to care is that the platform already exists, is free, and reaches every student in the programme, yet most do not use it. If regular use is a lever, the margin is large and cheap to move. If it is only a marker of the already-motivated, it is still useful: as an early warning of who is on track.
3. Setting and data
Section titled “3. Setting and data”The schools. JNVs are fully residential government schools, about one per district, that select rural children by entrance test at Class 6. Students board, so during the preparation years their daily routine, teaching, food and peers are the school’s, not the family’s. This holds many household confounders roughly fixed by design.
The programme. Students not selected into an intensive Centre of Excellence (CoE) receive Avanti’s
online programme (programme labels JNV NVS, JNV Enable, JNV Enable Plus). Its anchor is Lakshya’s
monthly full-length mock.
Three linked records, joined exactly on Avanti’s internal student id:
- Enrolment (
dim_student): the Class-12, engineering-stream students of 2025-26, with Class-10 board marks, social category, gender and school. These students have graduated, so their record is their 2025-26 record; every one of them also appears in the enrolment journey as Class 12 in 2025-26. - Platform logs (
fact_student_test_results_overall): one row per test attempt with start and end time. - JEE Main 2026 (
fact_student_jee_main_results_overall): qualification. For the online programme the file lists only qualifiers (786 students), so qualification is well defined for everyone (absent = did not qualify) but a percentile exists only for qualifiers.
Measuring regular practice. Most raw attempts are brief log-ins, so a valid sitting is one lasting 120 to 360 minutes. A student’s months of practice is the number of distinct calendar months with at least one valid sitting before 21 January 2026, when JEE Main Session 1 opened. Practice after that date cannot have caused the result and is excluded (94 sittings by 63 students). The early indicator is practice before 1 November 2025, the first seven months of Class 12.
What “regular” can and cannot mean here. Because Lakshya runs one mock a month, months of practice and number of tests coincide for 99.6% of practising students. We therefore cannot separate showing up regularly from practising more: in these data they are the same variable. A platform with more frequent tests, or a design that varies spacing, would be needed to tell them apart.
4. Who practises
Section titled “4. Who practises”| No practice | 1+ months | Difference | |
|---|---|---|---|
| Students | 6,867 | 2,076 | – |
| Female | 29% | 32% | +2.5 pp |
| Class-10 board, mean | 80.0 | 82.2 | +2.1 |
| Category, ST / SC / OBC / General | 12 / 23 / 41 / 24% | 13 / 21 / 42 / 24% | ≈ 0 |
| Months of practice, mean | 0.00 | 1.44 | +1.44 |
| Qualified JEE Main | 7.0% | 14.7% | +7.7 pp |
Practisers and non-practisers are nearly balanced on what we can see: the same category mix, a similar gender split, and Class-10 marks only about two points higher (82.2 against 80.0). Yet they qualify at about twice the rate. The raw gap is therefore not gross selection on observables; the small board difference is what the models adjust for. What the table cannot show is selection on what we cannot see, above all motivation.
| Boys | Girls | Difference | |
|---|---|---|---|
| Students | 6,271 | 2,672 | – |
| Class-10 board, mean | 80.3 | 81.2 | +0.9 |
| Category, ST / SC / OBC / General | 13 / 24 / 41 / 22% | 10 / 19 / 42 / 29% | girls: fewer ST/SC, more General |
| Months of practice, mean | 0.32 | 0.36 | +0.04 |
| Qualified JEE Main | 10.3% | 5.2% | −5.2 pp |
5. Empirical approach
Section titled “5. Empirical approach”For student i in school s, we estimate a logit of JEE Main qualification on months of practice:
logit Pr(qualify₍ᵢₛ₎) = β · months₍ᵢₛ₎ + γ · board₍ᵢₛ₎ + category + gender + αₛ
in three nested models: M1 raw; M2 adding Class-10 board, category and gender; M3 adding school fixed effects by conditional logit, so the comparison is between classmates. β is reported as an odds ratio. If abler or better-placed students simply practise more, β should fall sharply as controls enter.
The named threat is selection on unobservables. A student who chooses to sit a three-hour mock every month is, almost by definition, more motivated than one who does not, and motivation also raises JEE performance. Unlike the CoE comparison in the companion paper, where Avanti decides who enters each programme, here the student decides. No design available in these data removes that.
6. Results
Section titled “6. Results”6.1 Active against inactive
Section titled “6.1 Active against inactive”The simplest question: what is the difference between a student who used Lakshya at all before JEE and one who did not? We estimate it as a difference in the chance of qualifying, adding controls one rung at a time, with standard errors clustered by school.
| Comparison | Active minus inactive, chance of qualifying | 95% CI | p |
|---|---|---|---|
| Raw difference | +7.5 pp | [+5.6, +9.3] | p < 0.001 |
| + Class-10 board, category, gender | +6.5 pp | [+4.7, +8.2] | p < 0.001 |
| Board as ten bands instead of a line (+ category, gender) | +6.3 pp | [+4.6, +8.1] | p < 0.001 |
| + school fixed effects (classmates only) | +5.1 pp | [+2.8, +7.5] | p < 0.001 |
| Reweighting inactive students to look like active ones (IPW, effect on the active) | +6.6 pp | — | — |
Active students qualified at 14.7% against 7.3% (+7.5 pp raw). Holding Class-10 marks, category and gender fixed takes away only about one point: +6.5 pp. Replacing the straight-line board control with ten board bands changes nothing, so the result is not leaning on how marks are modelled. Comparing only classmates (school fixed effects) brings it to +5.1 pp: some of the gap is that active users are concentrated in stronger schools, but most of it survives. Reweighting inactive students so their marks, category and gender match the active group’s gives +6.6 pp. Every active and inactive student has a comparable counterpart (estimated chance of being active ranges only from 10% to 35%), so no part of the comparison is extrapolated.
6.2 More months, more qualification
Section titled “6.2 More months, more qualification”| Model | Odds ratio per month of practice | 95% CI | p | n |
|---|---|---|---|---|
| M1, unadjusted | 1.58 | [1.47, 1.71] | p < 0.001 | 8,943 |
| M2, + Class-10 board, category, gender | 1.50 | [1.37, 1.64] | p < 0.001 | 7,767 |
| M3, + school fixed effects (conditional logit) | 1.51 | [1.31, 1.75] | p < 0.001 | 5,222 / 288 JNVs |
Each additional month of practice is associated with about 1.50 times the odds of qualifying, net of marks, category and gender. The estimate barely moves from M1 (1.58) through M2 to the within-school M3 (1.51, on 5,222 students in 288 schools). Class-10 board is itself strongly predictive (OR 1.08 per mark), so practice and prior attainment are separate channels.
In probabilities, which are easier to read:
| Months with a full-length test | Students | Qualified JEE Main (raw) | Predicted, ability-adjusted |
|---|---|---|---|
| 0 months | 6,867 | 7.0% | 7.8% |
| 1 month | 1,430 | 13.2% | 10.8% |
| 2 months | 443 | 16.0% | 14.8% |
| 3 or more | 203 | 22.7% | 19.7% (at 3) |
The ability-adjusted predictions (7.8% at no practice, 10.8% at one month, 19.7% at three) sit close to the raw rates, so adjusting for marks barely changes the picture.
Strongest where marks are already high.
| Class-10 board | 0 months | 1–2 months | 3+ months |
|---|---|---|---|
| below 80 | 5% (n = 2,648) | 7% (n = 657) | 8% (n = 63) |
| 80–90 | 6% (n = 1,999) | 14% (n = 557) | 22% (n = 60) |
| 90+ | 14% (n = 1,262) | 25% (n = 453) | 35% (n = 68) |
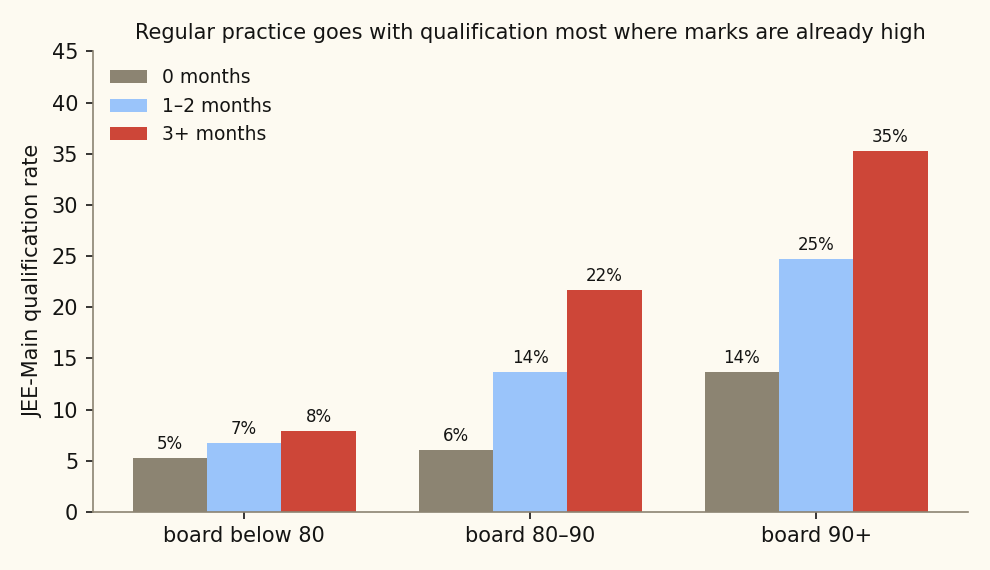
The board×practice interaction is positive and significant (p < 10⁻¹⁰). Whether that is a behavioural effect, or the mechanical fact that students with high marks sit closer to the qualifying cut-off so a given gain is more likely to carry them over, these data cannot say.
6.3 What every term in the model says
Section titled “6.3 What every term in the model says”The practice estimates above come from a model that also contains Class-10 marks, category, gender and (in M3) the school. Each of those has its own story:
| Term | Odds ratio [95% CI] | What it means |
|---|---|---|
| Each month of Lakshya practice | 1.50 [1.37, 1.64] | The practice effect, net of everything below |
| Each Class-10 board mark (maths + science average) | 1.08 [1.07, 1.09] | About 2.2× the odds per 10 marks: a steep, steady gradient |
| Boy (vs girl) | 2.02 [1.64, 2.49] | Boys have about twice girls’ odds with the same marks, category and practice |
| OBC (vs General) | 1.49 [1.14, 1.95] | Mostly the lower JEE qualifying cut-off, not ability |
| SC (vs General) | 4.27 [3.25, 5.61] | The SC cut-off is far lower again |
| ST (vs General) | 9.70 [7.27, 12.94] | The lowest cut-off; a measure of the cut-off, not of ability |
| School (random effect, in the linear model) | spread ±5.3 pp | One school-to-school standard deviation in the chance of qualifying |
- Prior marks move the odds steadily: about 2.2 times per ten board marks. Practice and marks are separate channels; practice does not stand in for marks, and marks do not explain practice away.
- Gender. Boys have 2.02 times girls’ odds at the same marks, category, and months of practice. Section 11 shows the gap is widest among the strongest students and that practice does not close it.
- Category. The large category odds ratios (OBC 1.49, SC 4.3, ST 9.7, all against General) mostly measure the JEE qualifying cut-off, which is set far lower for reserved categories, not differences in ability. They are there so the practice estimate is not confused by category; they should not be read as “ST students do better”.
- Schools differ a lot. One school-to-school standard deviation is about ±5.3 percentage points in the chance of qualifying, large next to an average of 8.8%. Among the 383 schools with at least ten students in the sample, 30% produced no qualifier at all, the median school 7%, a quarter more than 14%, and the best 44%. That is why the within-school comparisons (M3 and the school-fixed-effects rung above) matter: they remove all of this.
7. Did active users get better at taking the test?
Section titled “7. Did active users get better at taking the test?”If regular practice works by teaching test-taking, the clearest place to see it is inside the platform: a student’s second and third mocks should show better strategy than their first. JEE Main has negative marking, so good strategy means answering what you know, skipping what you don’t, and using the full three hours.
For every valid sitting of the monthly system-wide mock before Session 1 (2,933 sittings across 8 tests), the platform records five measures: score (as % of maximum; average 34%), accuracy (correct ÷ attempted; 60%), attempt rate (attempted ÷ total; 63%), wrong answers, and minutes used (average 128 of 180). Tests differ in difficulty, so each measure is compared within the same test, as a z-score against everyone in the cohort who sat it. We then follow the 628 students with two or more sittings (1,521 sittings) and ask how much each measure changes per extra sitting for the same student.
| Measure (z-score within each test) | Change per extra sitting, same student | p | First sitting: one-time users | First sitting: 3+ month users |
|---|---|---|---|---|
| Score (% of maximum) | +0.010 [−0.04, +0.06] | p = 0.669 | +0.04 | −0.08 |
| Accuracy (correct ÷ attempted) | +0.014 [−0.03, +0.06] | p = 0.572 | −0.03 | +0.01 |
| Attempt rate (attempted ÷ total) | +0.020 [−0.03, +0.07] | p = 0.447 | +0.08 | −0.14 |
| Wrong answers (negative marking) | +0.011 [−0.04, +0.06] | p = 0.670 | +0.06 | −0.09 |
| Minutes used | −0.008 [−0.07, +0.05] | p = 0.788 | −0.21 | +0.29 |
No measurable improvement. For the same student, none of the five measures moves across sittings relative to peers on the same paper; every estimate is close to zero, with confidence intervals within about ±0.07 of a standard deviation. Regular users did not pull ahead of first-time users on the later papers.
What differs is who they were at the start. On their very first sitting, students who would go on to practise in three or more months already used more of the time (+0.29 SD against −0.21 for one-time users), attempted more selectively (−0.14) and gave fewer wrong answers (−0.09), without scoring higher (−0.08). Careful, unhurried test-taking is a trait they brought with them.
What test-taking strategy could look like. On negatively marked entrance exams, strategy is mostly about when to skip. Women skip more than men with the same knowledge, which lowers their scores (Baldiga 2014), and in Finnish university entrance exams women omit about one more item than comparable men and answer too few to maximise their chance of entry (Pekkarinen 2014). In Turkey’s entrance exam the effect of these differences on scores is small, explaining about a tenth of the gender gap (Akyol, Key & Krishna 2016). When Chile removed the penalty for wrong answers from its national college entry exam, a large gender gap in skipped questions shrank, and the score gap narrowed, mainly among high performers (Coffman & Klinowski 2020). So better strategy is a plausible but modest channel, and the absence of measured improvement here is not surprising.
How to read this, carefully. Three things limit it. (1) It covers active students only: inactive students have no sittings, so there is no comparison group for strategy. (2) The benchmark is other students on the same paper, many of whom are also practising, so a gain shared by everyone who practises would not show. (3) A few sittings a year may simply be too few to move these measures. With those caveats, the data do not show regular practice working through visibly better test-taking on the platform, which strengthens the reading that part of the qualification gap is who practises rather than what practice does.
8. Early indicators
Section titled “8. Early indicators”The question a programme manager asks is not “who practised all year?” but “who, by now, looks on track?”. Practice in the first seven months of Class 12 already answers part of it:
- 13% of students had practised at least once by the end of October. In the regression with Class-10 marks, category and gender, that goes with 1.82 times the odds [1.49, 2.23] of qualifying: a predicted 13.4% against 8.3% at the same marks, category and gender. (Raw rates: 15.6% against 7.7%.)
- Counting early months rather than a yes/no gives an odds ratio of 1.71 [1.45, 2.02] per month, slightly stronger than the full-year measure. The late-year version of reverse causation, in which students who sense they are on track keep sitting tests, would predict the opposite.
- As a screen it misses most qualifiers. Only 24% of eventual qualifiers had practised by October, and 39% practised at all. Most students who qualify do so without the platform, so early practice identifies a group with good odds; it does not find the qualifiers.
Early-warning research shows the same trade-off. Chicago’s freshman on-track flag classifies graduates and non-graduates correctly about 80% of the time at year-end, but earlier, fall-semester versions are less accurate (76% and 74%, with much lower specificity): timeliness costs accuracy (Allensworth & Easton 2007). That literature also recommends reporting both how many of the target group a flag catches and how many it flags wrongly, since the same flag can look 33% or 90% “accurate” depending on the measure (Knowles 2015). A review of 110 dropout flags across 36 studies found most have high precision but low overall accuracy (Bowers, Sprott & Taff 2013), and the recommended summary, the area under the ROC curve, treats 0.5 as a coin flip, and the screening standard it cites counts only values above 0.85 as convincing (Bowers & Zhou 2019). For the October flag here: it catches 24% of eventual qualifiers, and students it flags qualify at about twice the rate of those it does not.
Read together: early, regular practice is a cheap, timely positive signal worth acting on (for example, by prioritising those students for additional support), but its absence is not a negative signal.
8.1 How early, and do Lakshya scores add?
Section titled “8.1 How early, and do Lakshya scores add?”Lakshya’s system-wide mocks for this cohort ran monthly from September 2025. Here a serious attempt is a valid sitting (120 to 360 minutes on the clock) of a JEE-type paper (2,893 sittings on 7 papers; the NEET, CLAT and CA papers offered alongside are dropped). For each date, only sittings before it are used. A student’s Lakshya score is their average within-test percentile among the cohort students who sat the same paper, so a hard paper and an easy one compare. AUC is the chance that the model ranks a random qualifier above a random non-qualifier (0.5 is a coin flip); the base model, Class-10 marks, category and gender, scores 0.764.
| Using sittings before | Active | Odds ratio, active | Qualifiers already active | Class-10 80+ and active: qualify (share of all qualifiers) | AUC: + active / + Lakshya score |
|---|---|---|---|---|---|
| 1 October | 9.8% | 1.73 [1.38, 2.18] | 17% | 20.0% (13%) | 0.769 / 0.769 |
| 1 November | 12.8% | 1.89 [1.55, 2.32] | 23% | 20.2% (17%) | 0.771 / 0.771 |
| 1 December | 18.1% | 1.89 [1.57, 2.27] | 30% | 19.4% (22%) | 0.772 / 0.772 |
| 1 January | 21.5% | 1.95 [1.64, 2.33] | 35% | 19.6% (26%) | 0.773 / 0.774 |
| 21 January (Session 1) | 22.5% | 2.04 [1.71, 2.42] | 38% | 19.8% (28%) | 0.775 / 0.776 |
- Length of signal. One test (by 1 October) already shows the gap (odds ratio 1.73). By 1 November, after two tests, it is at full strength (1.89) and stays there. What later months add is coverage: the share of eventual qualifiers who are already active grows from 23% to 38%.
- Active and strong. Students with Class-10 marks of 80+ who are active qualify at about 20% at every date. Adding “top half on Lakshya score” lifts that only to 24% by Session 1 while halving the group (it catches 16% of qualifiers instead of 28%).
- Scores add little. Each 10 points of Lakshya score goes with 1.06 times the odds of qualifying (p = 0.021), significant only from January, and moves the AUC in the third decimal. Among the 620 students with two or more serious sittings, the first sitting’s score and their average agree closely (correlation 0.82), but neither ranks qualifiers well (AUC 0.55 and 0.57).
Why the scores do not help yet. On these sittings the scores do not behave like a measure of ability. They are unrelated to Class-10 marks (correlation −0.07); they track how many questions a student attempted (0.70) more than accuracy; one sitting in ten scores above 74% on a JEE-level paper (median 29%); and the school a student sits in explains 31% of the variation in scores, against 19% for Class-10 marks, with near-identical scores across a school in 5% of school-test groups. That pattern fits unsupervised or shared sittings, but we have not verified it. Among students who qualified, Lakshya scores do correlate with the JEE percentile reached, so the tests carry some signal; it is drowned out in the cohort as a whole.
9. Scores of strong students, and the same schools a year apart
Section titled “9. Scores of strong students, and the same schools a year apart”Sections 6 to 8 use qualification, which depends on category cut-offs. This section asks the sharper question about the students for whom it matters most: among strong students (Class-10 board average of 80 or more), do active users reach high JEE percentiles more often, and in the same schools a year apart, did more students become active and did the active ones score higher?
Sample and measure. Both cohorts, JEE 2025 and JEE 2026, restricted to the 174 matched JNVs that have Avanti online engineering students in both years, so every comparison is on the same schools (3,179 of 3,251 students in 2025, 2,398 of 9,163 in 2026). The 2026 results file lists qualifiers only, so the outcomes are percentile bars that every included student’s category clears: the 94th percentile for everyone, the 83rd for OBC, SC and ST, and the 65th for SC and ST. In JEE Main 2026 these are All-India Ranks of about 92,000, 2.7 lakh and 5.7 lakh (median rank of students in our results within a quarter point of each bar; for comparison the 99th percentile is about 15,000). (2026 qualifying cut-offs: General 93.4, EWS 82.4, OBC 80.9, SC 63.9, ST 52.0). Above these bars every student is in the file in both years. Gaps are adjusted for Class-10 marks, category, gender and school, so they compare classmates. The 2025 cohort has no Class-10 marks on its enrolment record, so its marks come from the board records through the identity map (1,993 of 3,179 students).
9.1 Strong students, JEE 2026
Section titled “9.1 Strong students, JEE 2026”| Students and score bar | Inactive, per 100 | Active, per 100 | Adjusted gap | 95% CI | p |
|---|---|---|---|---|---|
| All categories, 94th percentile or above | 0.3 (3 of 979) | 3.0 (12 of 398) | +1.8 pp | [+0.2, +3.4] | p = 0.030 |
| OBC, SC and ST, 83rd percentile or above | 2.9 (21 of 713) | 9.9 (28 of 282) | +6.3 pp | [+1.7, +10.9] | p = 0.007 |
| SC and ST, 65th percentile or above | 16.9 (45 of 266) | 28.1 (32 of 114) | +6.1 pp | [−12.0, +24.2] | p = 0.507 |
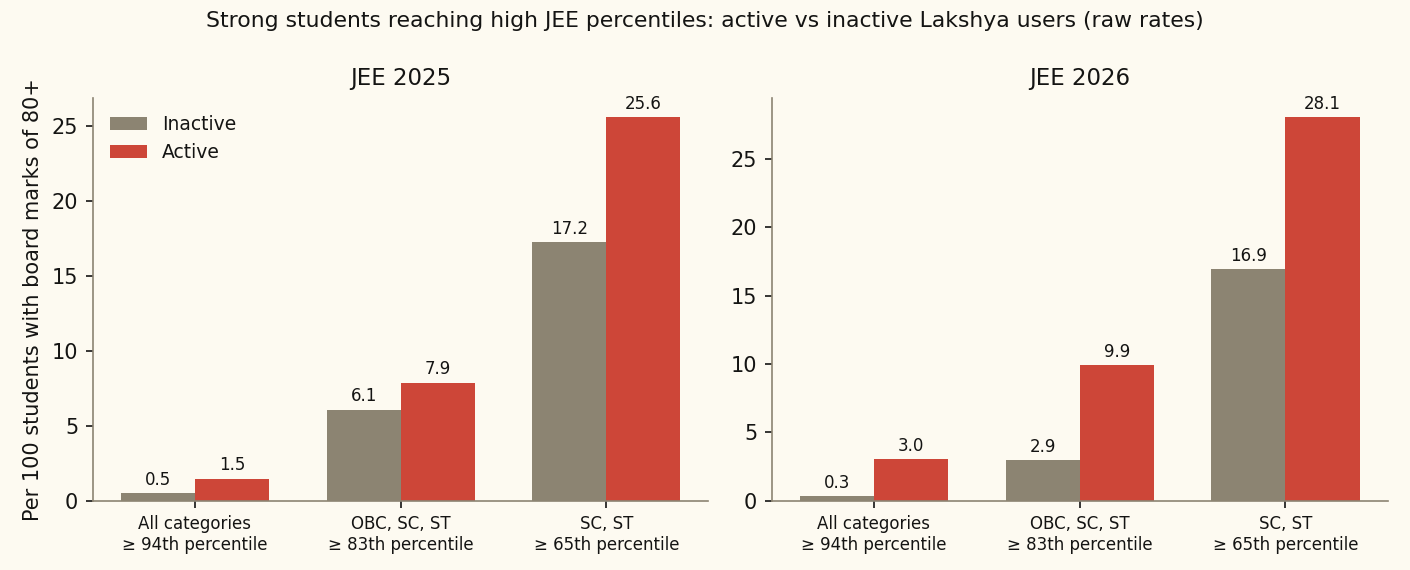
Among OBC, SC and ST strong students, active users reached the 83rd percentile about 3.4 times as often as inactive ones: 9.9 against 2.9 per 100, an adjusted gap of +6.3 pp [+1.7, +10.9]. At the 94th percentile the rates are small (3.0 against 0.3 per 100) but the gap is positive (+1.8 pp). Among strong qualifiers, active users scored +3.2 percentile points higher [+0.2, +6.3]. Restricting to schools that have both active and inactive strong students gives the same picture (Appendix B).
The JEE 2025 cohort points the same way without significance (every gap has the same sign; Appendix B). It is the one year whose file includes everyone who sat: among strong students with a score, active users’ median percentile was 65.5 against 59.9 (+3.8 points adjusted, p = 0.060). Active users were also more likely to sit JEE at all (63% against 50% have a score), so part of any gap is who sits.
9.2 The same schools, 2025 and 2026
Section titled “9.2 The same schools, 2025 and 2026”| Students | Measure | 2025 | 2026 | Change distinguishable from chance? |
|---|---|---|---|---|
| All engineering students | Meaningfully active | 27.6% (878 of 3,179) | 27.6% (662 of 2,398) | p = 0.992 |
| All engineering students | Active students at the 94th percentile or above | 0.9% (8 of 878) | 1.8% (12 of 662) | p = 0.122 |
| All engineering students | Active OBC/SC/ST students at the 83rd or above | 4.7% (29 of 620) | 6.4% (32 of 499) | p = 0.204 |
| All engineering students | Everyone at the 94th percentile or above | 0.4% (13 of 3,179) | 0.7% (17 of 2,398) | p = 0.129 |
| Strong students (board 80+) | Meaningfully active | 33.0% (409 of 1,239) | 28.9% (398 of 1,377) | p = 0.023 |
| Strong students (board 80+) | Active students at the 94th percentile or above | 1.5% (6 of 409) | 3.0% (12 of 398) | p = 0.137 |
| Strong students (board 80+) | Active OBC/SC/ST students at the 83rd or above | 7.9% (21 of 267) | 9.9% (28 of 282) | p = 0.397 |
| Strong students (board 80+) | Everyone at the 94th percentile or above | 0.8% (10 of 1,239) | 1.1% (15 of 1,377) | p = 0.459 |
More students did not become active. In the same schools the active share is flat (27.6% and 27.6%); school by school it rose in 61 and fell in 72 of 137 schools.
The qualifiers, as the top performers. Participation is recorded for the whole class both years, so the qualifiers can stand in for the top of the class:
| Same schools | 2025 | 2026 |
|---|---|---|
| Students in the class | 3,179 | 2,398 |
| Qualified JEE Main | 251 (7.9%) | 247 (10.3%) |
| … qualification rate, active students | 12.5% | 16.5% |
| … qualification rate, inactive students | 6.1% | 7.9% |
| Active share of all students | 27.6% | 27.6% |
| Active share of qualifiers | 43.8% | 44.1% |
| Start: median Class-10 board, active students | 85.5 | 84.5 |
| Start: median Class-10 board, inactive students | 82.5 | 83.0 |
| Start: median Class-10 board, active qualifiers | 91.8 | 90.0 |
| Start: median Class-10 board, inactive qualifiers | 88.5 | 84.8 |
| Median percentile of qualifiers | 81.1 | 78.5 |
| … active qualifiers | 81.2 | 81.7 |
| … inactive qualifiers | 80.5 | 75.4 |
- More students qualified (p = 0.002), active and inactive alike, while the class in these schools was smaller and did not start stronger (its median Class-10 board was about the same both years).
- Active users are over-represented among qualifiers, by the same margin both years: about 44% of qualifiers against about 27% of the class (p = 0.945 for the change), qualifying at about twice the rate of inactive students.
- Their scores did not clearly rise. Active qualifiers’ median held while inactive qualifiers’ fell; the difference is +4.4 points [−1.7, +10.5] (p = 0.156).
9.3 Start and end for the qualifiers
Section titled “9.3 Start and end for the qualifiers”| Qualifiers’ Class-10 board | 2025 inactive | 2025 active | 2026 inactive | 2026 active |
|---|---|---|---|---|
| Board below 80 | 63.5 (n=22) | 67.1 (n=13) | 72.7 (n=46) | 70.7 (n=20) |
| Board 80-90 | 75.7 (n=39) | 74.0 (n=22) | 68.0 (n=47) | 75.5 (n=32) |
| Board 90 and above | 85.1 (n=52) | 85.4 (n=49) | 82.5 (n=43) | 87.3 (n=53) |
Active qualifiers started ahead: median Class-10 board 91.8 and 90.0, against 88.5 and 84.8 for inactive qualifiers. Most of the gap at the end is the gap at the start: with the same marks, category, gender and school, active qualifiers finished +0.9 points higher in 2025 and +3.7 in 2026 [−5.1, +12.6], neither distinguishable from zero. The only hint of extra lift is among strong starters in 2026 (board 80–90 and 90+), in groups of a few dozen. The extra 2026 qualifiers came mostly from inactive students with lower starting marks, which is why the inactive median percentile fell.
9.4 What the scores add
Section titled “9.4 What the scores add”The scores reinforce the main reading rather than change it. Active preparers are the students who use the platform and keep using it: they are over-represented among qualifiers and high scorers by the same margin each year, they started ahead, and they did not pull further ahead between the two years. That makes activity on Lakshya a good way to find many of the students preparing seriously, early (Section 8), though not all of them. It does not show a lift from Lakshya itself, and use did not spread in the schools it reached first.
Punjab: an inconclusive replication. The same analysis for Avanti’s online Punjab students (STP Test Series and Broadcast; centres and the live class excluded) cannot settle the question. Only 3.1% (JEE 2025) and 6.5% (JEE 2026) of students were active, Class-10 marks exist for 10 of 27,292 students in 2025, and JEE results are reported for 6.7% and 24.6% of each cohort, more often by active students. In 2026 active students with a result qualified at 11.9 against 6.2 per 100 (adjusted +4.5 points), and among strong students 13.7 against 6.2 (+5.9 points [+0.3, +11.4]); in 2025 there is no gap (−0.8 points). Most Punjab full-paper sittings last under 30 minutes, and with a looser activity rule the 2026 gap disappears. The lesson is about the data: Punjab’s JEE results need collecting for the whole cohort.
10. Robustness
Section titled “10. Robustness”| Check | Estimate | What it rules out |
|---|---|---|
| Practice before November only (April–October of Class 12) | OR 1.71 [1.45, 2.02] | Late-year reverse causation: a student on track keeps sitting tests |
| Any practice before November (yes/no) | OR 1.82 [1.49, 2.23] | The same, as a simple early flag |
| The v1 measure: all valid tests in the year, including after JEE Session 1 | OR 1.49 [1.37, 1.62] | Nothing: shows the headline does not depend on the timing rule |
| M2 re-run on the fixed-effects schools only | OR 1.44 [1.31, 1.58] | That M3’s stability is a change of sample |
| Dose-response, months as categories (vs 0) | 1: 1.84 · 2: 2.18 · 3+: 3.23 | A single-step artefact; shows a gradient |
| Oster δ* (Rmax = 1.3·R1 / 2·R1 / 1.0) | 18.3 / 5.5 / 0.52 | Moderate hidden selection; not selection that explains everything |
- Timing. Restricting to practice before November strengthens the estimate. Using the earlier version’s measure, every valid test in the year including after Session 1, gives the same result, so the headline does not depend on the timing rule.
- The fixed-effects sample. Conditional logit uses only the 288 schools with variation in the outcome. Re-running M2 on exactly those students gives 1.44, so the stability is not a sample artefact. The 259 dropped schools are the weakest: mean board 79 against 81, and a qualification rate of 2.0% against 12.5%. “Holds between classmates” applies to the schools that produce qualifiers.
- Dose-response. Treating months as categories, the odds ratios against no practice rise from 1.84 (one month) to 2.18 (two) and 3.23 (three or more): a gradient, with the largest single step at the first month.
- Oster bound. Under the conventional Rmax = 1.3·R1, selection on unobservables would need to be about 18 times selection on the observed controls to explain the result away; at 2·R1, 5.5. Only under the extreme assumption that the model could explain all variation (Rmax = 1) does it fall below 1 (0.52). The bound is computed on a linear-probability analogue of a rare binary outcome, so it is indicative.
- Within qualifiers. Among the 705 qualifiers with a recorded percentile, each month of practice goes with 1.2 percentile points more [0.3, 2.1]. The sample is selected and range-restricted, so this carries no weight.
11. Gender
Section titled “11. Gender”Girls on the engineering track qualify at 5.2%, boys at 10.3%. With the same Class-10 marks and category, girls have 0.51 times boys’ odds [0.42, 0.63]. The gap is widest among the strongest students: at board 90 and above, 10% of girls qualify against 21% of boys.
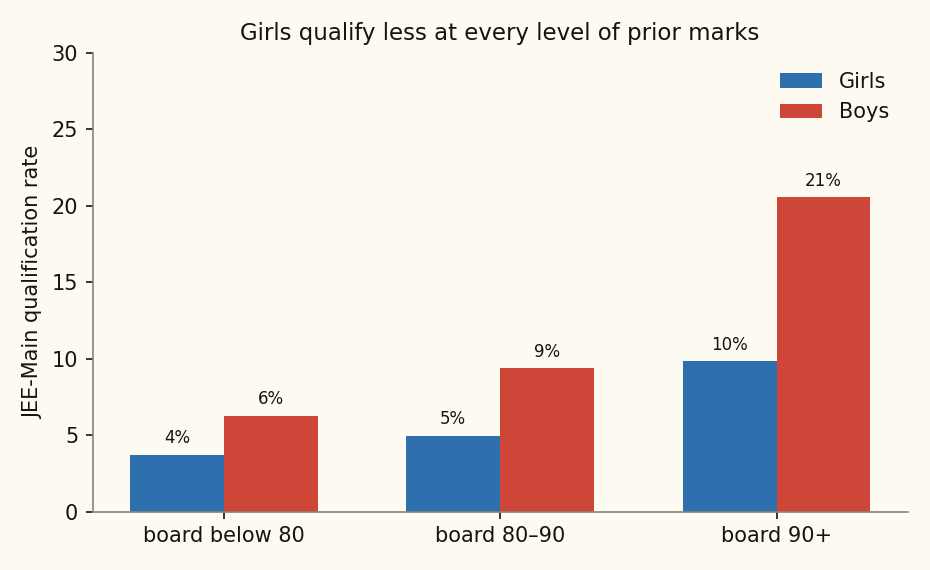
It is not effort. Girls practise at least as many months as boys (0.36 against 0.32 on average), and practice goes with qualification for both: OR 1.32 [1.08, 1.60] for girls and 1.55 [1.40, 1.71] for boys. But it does not close the gap. Without practice girls qualify at 4% against 8%; with it, 8% against 18%. The practice×gender interaction (OR 0.85, p = 0.13) is not significant, so the conservative statement is that practice does not detectably narrow the gap. This matches a wider pattern in which girls lose ground as exam stakes rise: in China girls’ relative performance falls 0.15 SD from a mock to the Gaokao (Cai, Lu, Pan & Zhong 2019), and in Spain girls’ low-stakes advantage shrinks on high-stakes tests and reverses in science (Azmat, Calsamiglia & Iriberri 2016); in the HEC Paris entrance exams women do worse than men in the most competitive stage but better in the less competitive ones (Ors, Palomino & Peyrache 2013); responses to competition are one candidate explanation (Niederle & Vesterlund 2010). In India, households invest less in girls’ education at these ages: they are less likely to buy them private tutoring (Azam 2016), spend less on them, partly by choosing fee-free government schools for daughters (Azam & Kingdon 2013), and girls are about 20 points less likely than their brothers to take science or commerce at all (Sahoo & Klasen 2021). Safety and mobility also weigh on young women’s choices (Borker 2021). One reading we cannot rule out is that sitting the platform’s tests is a worse proxy for real preparation among girls, which would attenuate their estimate.
12. Caveats
Section titled “12. Caveats”This paper carries more caveats than its companion, and they are worth stating together:
- The treatment is self-chosen. Students decide whether to sit the tests. This is the central weakness of every usage-outcome study in education technology: reviews of the field restrict themselves to randomised and regression-discontinuity studies for this reason (Escueta et al. 2017), observational studies of computer access tend to find larger effects than experiments, which the authors suggest may reflect selection (Bulman & Fairlie 2016), and SRI’s study of Khan Academy in schools, which found more use associated with better-than-predicted scores, says these associations cannot establish effectiveness (Murphy et al. 2014). The one Indian benchmark is reassuring in a narrow way: for the Mindspark after-school programme, a value-added usage estimate could not be distinguished from the lottery-based estimate (Muralidharan, Singh & Ganimian 2019), though that comparison partly drew on randomised variation and does not transfer to a self-chosen test. Motivation, conscientiousness or exam stamina could produce both regular practice and qualification. Every check above narrows this; none removes it.
- Non-qualifiers cannot be split. The online programme’s JEE file holds qualifiers only, so a student who failed and a student who never sat the exam look the same. If students who never intended to sit JEE also skipped Lakshya, part of the association is “who sat the exam”, not “who passed it”.
- Regularity and volume are the same variable here. One test a month means we cannot tell whether spacing or quantity matters.
- One cohort, one year. Platform logs exist for the 2026 cohort only; there is no trend and no replication.
- Most qualifiers never used the platform. 39% of qualifiers practised at all, so the platform describes a minority route to qualification.
- Other preparation is invisible. Self-study, books, other apps and school teaching are not observed; a student who prepares elsewhere looks like a non-practiser.
- Missing marks. 7,767 of 8,943 students have Class-10 marks; the controlled models use only them.
- No strategy data for inactive students. Section 7 can compare active students only with themselves and with each other.
- Secondary cuts are exploratory. The board interaction, the early-indicator split and the gender analysis are not pre-registered or adjusted for multiplicity.
13. What this means
Section titled “13. What this means”Active preparers are the students who use Lakshya and keep using it. Their chance of qualifying is about 6.5 percentage points higher than inactive students’ with the same marks (nearly double), and strong active students reach the top percentiles at about three times the rate of their schoolmates. The combination is the useful part: being active together with strong Class-10 marks marks out, by November and after only two monthly tests, a group that qualifies at about 20%, two and a half times everyone else. Platform scores do not sharpen that yet. But the scores and the same-school comparison point the same way as the strategy analysis: active preparers started ahead, did not pull further ahead, and their share of the class did not grow. Lakshya finds students who are preparing seriously; these data do not show it lifting them. What exists today is a large, active playground.
That sets the next step, and it is the same playbook that produced the state-system gains: find students through testing, then make sure they sit the exam and are counselled through it.
- Flag early. Use “active and strong by November” to find students preparing seriously, knowing it catches about 23% of eventual qualifiers at that point: a promising group, not every likely qualifier. Keep widening the net through the year.
- Support the flagged students: counselling, exam fees where needed, mocks with feedback and work on test-taking strategy.
- Roll it out so the lift can be measured: offer support to a random half of the flagged students, or to schools in a staggered order. Without that, next year’s gap will look like this year’s and still will not say whether the support worked.
- Fix the scores. Supervised sittings, or checks for shared answers, would let platform scores join the marker. At present they cannot be trusted as a measure of ability.
Appendix A. All students, activity in hours, logit
Section titled “Appendix A. All students, activity in hours, logit”A robustness check on Section 9 using every student with Class-10 marks rather than only those at 80+ (2,195 in 2026, 1,993 in 2025, matched schools), with activity as hours of full mocks before Session 1 in bands (2026: none 1,578, under 3 h 343, 3-8 h 249, 8 h or more 25; one mock is two to six hours on the clock). Each score bar is a logit with Class-10 marks, category, gender and state fixed effects (school dummies separate perfectly when the outcome is this rare; states where nobody clears the bar are dropped), beside the same specification as a linear model. Where the logit’s average marginal effect and the linear estimate agree, the functional form is not driving the result.
| Cohort | Students and score bar | Hours of full mocks (vs none) | Logit odds ratio | Logit average marginal effect | Linear model | Linear 95% CI |
|---|---|---|---|---|---|---|
| JEE 2025 | All categories, 94th percentile or above | under 3 h | 2.24 (p = 0.493) | +0.8 pp | +0.1 pp | [−1.7, +1.9] |
| JEE 2025 | All categories, 94th percentile or above | 3-8 h | 1.08 (p = 0.952) | +0.1 pp | +1.2 pp | [−1.1, +3.6] |
| JEE 2025 | All categories, 94th percentile or above | 8 h or more | 5.39 (p = 0.055) | +2.3 pp | +3.6 pp | [−1.1, +8.4] |
| JEE 2025 | OBC, SC and ST, 83rd percentile or above | under 3 h | 1.29 (p = 0.593) | +1.1 pp | +0.0 pp | [−4.6, +4.6] |
| JEE 2025 | OBC, SC and ST, 83rd percentile or above | 3-8 h | 2.31 (p = 0.064) | +4.4 pp | +3.2 pp | [−2.0, +8.3] |
| JEE 2025 | OBC, SC and ST, 83rd percentile or above | 8 h or more | 1.70 (p = 0.312) | +2.6 pp | +3.9 pp | [−3.4, +11.2] |
| JEE 2025 | SC and ST, 65th percentile or above | under 3 h | 1.13 (p = 0.783) | +1.1 pp | +1.0 pp | [−7.0, +9.1] |
| JEE 2025 | SC and ST, 65th percentile or above | 3-8 h | 2.20 (p = 0.059) | +8.0 pp | +6.2 pp | [−3.1, +15.6] |
| JEE 2025 | SC and ST, 65th percentile or above | 8 h or more | 2.43 (p = 0.122) | +9.3 pp | +9.6 pp | [−6.1, +25.4] |
| JEE 2026 | All categories, 94th percentile or above | under 3 h | 0.62 (p = 0.663) | −0.2 pp | −0.2 pp | [−1.3, +0.8] |
| JEE 2026 | All categories, 94th percentile or above | 3-8 h | 6.14 (p = 0.003) | +2.8 pp | +3.8 pp | [+0.9, +6.8] |
| JEE 2026 | All categories, 94th percentile or above | 8 h or more | 13.37 (p = 0.003) | +6.2 pp | +12.5 pp | [−1.5, +26.6] |
| JEE 2026 | OBC, SC and ST, 83rd percentile or above | under 3 h | 2.17 (p = 0.018) | +3.2 pp | +3.3 pp | [+0.1, +6.6] |
| JEE 2026 | OBC, SC and ST, 83rd percentile or above | 3-8 h | 1.77 (p = 0.122) | +2.2 pp | +2.8 pp | [−0.9, +6.5] |
| JEE 2026 | OBC, SC and ST, 83rd percentile or above | 8 h or more | 9.52 (p = 0.001) | +17.2 pp | +21.2 pp | [+1.3, +41.2] |
| JEE 2026 | SC and ST, 65th percentile or above | under 3 h | 1.52 (p = 0.148) | +5.2 pp | +5.6 pp | [−2.4, +13.7] |
| JEE 2026 | SC and ST, 65th percentile or above | 3-8 h | 0.78 (p = 0.465) | −2.6 pp | −2.7 pp | [−10.9, +5.4] |
| JEE 2026 | SC and ST, 65th percentile or above | 8 h or more | 5.29 (p = 0.033) | +27.1 pp | +30.9 pp | [−0.0, +61.8] |
The 2026 estimates rise with hours, largest at 8 hours or more (four or more mocks); the gain grows with Class-10 marks for OBC, SC and ST at the 83rd percentile (p = 0.002); 2025 is too sparse to fit for two of the three bars. The students who sit four or more mocks are the most motivated, so this is an association, not a dose.
Appendix B. Strong students: JEE 2025, and same schools only
Section titled “Appendix B. Strong students: JEE 2025, and same schools only”JEE 2025, strong students:
| Students and score bar | Inactive, per 100 | Active, per 100 | Adjusted gap | 95% CI | p |
|---|---|---|---|---|---|
| All categories, 94th percentile or above | 0.5 (4 of 830) | 1.5 (6 of 409) | +1.1 pp | [−0.6, +2.9] | p = 0.209 |
| OBC, SC and ST, 83rd percentile or above | 6.1 (34 of 560) | 7.9 (21 of 267) | +2.6 pp | [−2.4, +7.6] | p = 0.314 |
| SC and ST, 65th percentile or above | 17.2 (36 of 209) | 25.6 (22 of 86) | +6.3 pp | [−12.1, +24.8] | p = 0.502 |
Only schools that have both active and inactive strong students (every comparison between classmates):
| Cohort | Students and score bar | Schools | Inactive, per 100 | Active, per 100 | Gap | 95% CI |
|---|---|---|---|---|---|---|
| JEE 2025 | All categories, 94th percentile or above | 87 | 0.6 (3 of 497) | 1.8 (6 of 333) | +1.1 pp | [−0.7, +2.8] |
| JEE 2025 | OBC, SC and ST, 83rd percentile or above | 70 | 5.8 (16 of 274) | 8.4 (18 of 214) | +2.5 pp | [−2.5, +7.4] |
| JEE 2025 | SC and ST, 65th percentile or above | 33 | 23.3 (14 of 60) | 32.7 (16 of 49) | +7.4 pp | [−10.2, +25.0] |
| JEE 2026 | All categories, 94th percentile or above | 91 | 0.3 (2 of 628) | 3.1 (11 of 351) | +1.7 pp | [+0.2, +3.2] |
| JEE 2026 | OBC, SC and ST, 83rd percentile or above | 81 | 3.3 (14 of 420) | 10.6 (26 of 246) | +5.8 pp | [+1.5, +10.2] |
| JEE 2026 | SC and ST, 65th percentile or above | 38 | 19.0 (15 of 79) | 29.9 (20 of 67) | +6.9 pp | [−11.6, +25.4] |
Replication data
Section titled “Replication data”The de-identified row-level input (internal student id and school kept for the fixed effects; no names, dates of birth or contact details) and every figure are on the public bucket:
- validation_data.csv and results.json
- Figures: practice · board × practice · gender gap · gender × practice
- Section 9 and the appendices: scores_validation_data.csv (same de-identification), scores.json, figure; Section 8.1: signal.json (aggregates only); the Punjab box: punjab_results.json (aggregates only; the Punjab panel carries ids and is not published)
- Code:
analyze_lakshya_practice.py(BigQuery →output/results.json, figures, validation CSV)analyze_scores.py(Section 9, appendices),analyze_punjab.py(the Punjab box),analyze_signal.py(Section 8.1 and the rank translations) andpaper_render.py(fills this paper from all four). The July 2026 version, with the category-screen extension, is frozen inv1/.
References
Section titled “References”[download] is the archived copy that was read (avantifellows.org accounts only; checksums in SOURCES.md).
- Adesope, O. O., Trevisan, D. A., & Sundararajan, N. (2017). Rethinking the use of tests: A meta-analysis of practice testing. Review of Educational Research, 87(3), 659–701. download
- Agarwal, P. K., Bain, P. M., & Chamberlain, R. W. (2012). The value of applied research: Retrieval practice improves classroom learning. Educational Psychology Review, 24(3), 437–448. download
- Karpicke, J. D., & Roediger, H. L. (2008). The critical importance of retrieval for learning. Science, 319(5865), 966–968. download
- Oster, E. (2019). Unobservable selection and coefficient stability: theory and evidence. Journal of Business & Economic Statistics, 37(2), 187–204. download
- Roediger, H. L., & Karpicke, J. D. (2006). Test-enhanced learning: taking memory tests improves long-term retention. Psychological Science, 17(3), 249–255. download
- Rowland, C. A. (2014). The effect of testing versus restudy on retention: a meta-analytic review of the testing effect. Psychological Bulletin, 140(6), 1432–1463. download
Added 7 October 2026. Each work below was downloaded, read, and its claims checked against the archived copy before being cited. Where the copy read is a working paper of the journal article, the reference says so.
- Akyol, S. P., Key, J., & Krishna, K. (2016). Hit or Miss? Test Taking Behavior in Multiple Choice Exams. NBER Working Paper No. 22401. (Later published in Annals of Economics and Statistics, 2022.) https://www.nber.org/papers/w22401 download
- Allensworth, E. M., & Easton, J. Q. (2005). The On-Track Indicator as a Predictor of High School Graduation. Chicago: Consortium on Chicago School Research, University of Chicago. https://consortium.uchicago.edu/publications/track-indicator-predictor-high-school-graduation download
- Allensworth, E. M., & Easton, J. Q. (2007). What Matters for Staying On-Track and Graduating in Chicago Public High Schools: A Close Look at Course Grades, Failures, and Attendance in the Freshman Year. Chicago: Consortium on Chicago School Research, University of Chicago. https://consortium.uchicago.edu/publications/what-matters-staying-track-and-graduating-chicago-public-schools download
- Arenas, A. and Calsamiglia, C. (2022). Gender Differences in High-Stakes Performance and College Admission Policies. IZA Discussion Paper No. 15550. https://ideas.repec.org/p/iza/izadps/dp15550.html download
- Azam, M. (2016). Private Tutoring: Evidence from India. Review of Development Economics, 20(4), 739-761. (Copy read: IZA Discussion Paper No. 8770, January 2015.) https://doi.org/10.1111/rode.12195 download
- Azam, M. and Kingdon, G. G. (2013). Are Girls the Fairer Sex in India? Revisiting Intra-Household Allocation of Education Expenditure. World Development, 42, 143-164. Copy read: IZA Discussion Paper No. 5706 (2011). https://doi.org/10.1016/j.worlddev.2012.09.003 download
- Azmat, G., Calsamiglia, C. and Iriberri, N. (2016). Gender Differences in Response to Big Stakes. Journal of the European Economic Association, 14(6), 1372-1400. Copy read: CEP Discussion Paper No. 1314, revised October 2015. https://doi.org/10.1111/jeea.12180 download
- Baldiga, K. (2014). Gender Differences in Willingness to Guess. Management Science, 60(2), 434-448. (Downloaded copy: working paper dated August 30, 2012.) https://doi.org/10.1287/mnsc.2013.1776 download
- Borker, G. (2021). Safety First: Perceived Risk of Street Harassment and Educational Choices of Women. World Bank Policy Research Working Paper 9731. https://documents.worldbank.org/curated/en/723631626710146405 download
- Bulman, G., & Fairlie, R. W. (2016). Technology and Education: Computers, Software, and the Internet. In E. Hanushek, S. Machin & L. Woessmann (Eds.), Handbook of the Economics of Education, Vol. 5, 239-280. Downloaded copy: NBER Working Paper No. 22237 (May 2016). https://doi.org/10.1016/B978-0-444-63459-7.00005-1 download
- Cai, X., Lu, Y., Pan, J., & Zhong, S. (2019). Gender Gap under Pressure: Evidence from China’s National College Entrance Examination. Review of Economics and Statistics, 101(2), 249-263. (Copy read: authors’ working-paper version, October 2016.) https://doi.org/10.1162/rest_a_00749 download
- Cepeda, N. J., Pashler, H., Vul, E., Wixted, J. T., & Rohrer, D. (2006). Distributed practice in verbal recall tasks: A review and quantitative synthesis. Psychological Bulletin, 132(3), 354-380. https://doi.org/10.1037/0033-2909.132.3.354 download
- Dunlosky, J. (2013). Strengthening the Student Toolbox: Study Strategies to Boost Learning. American Educator, 37(3), Fall 2013, 12-21. (Author’s practitioner summary of Dunlosky, Rawson, Marsh, Nathan & Willingham (2013), Psychological Science in the Public Interest 14(1), 4-58.) https://www.aft.org/ae/fall2013/dunlosky download
- Escueta, M., Quan, V., Nickow, A. J., & Oreopoulos, P. (2017). Education Technology: An Evidence-Based Review. NBER Working Paper No. 23744. Published as Escueta, M., Nickow, A. J., Oreopoulos, P., & Quan, V. (2020). Upgrading Education with Technology: Insights from Experimental Research. Journal of Economic Literature, 58(4), 897-996. https://doi.org/10.1257/jel.20191507 download
- Jurajda, S. and Munich, D. (2011). Gender Gap in Performance under Competitive Pressure: Admissions to Czech Universities. American Economic Review: Papers & Proceedings, 101(3), 514-518. Copy read: CERGE-EI Working Paper 371, ‘Gender Gap in Admission Performance under Competitive Pressure’, November 2008. https://doi.org/10.1257/aer.101.3.514 download
- Knowles, J. E. (2015). Of Needles and Haystacks: Building an Accurate Statewide Dropout Early Warning System in Wisconsin. Journal of Educational Data Mining, 7(3), 18-67. https://jedm.educationaldatamining.org/index.php/JEDM/article/view/JEDM082 download
- Muralidharan, K., Singh, A., & Ganimian, A. J. (2019). Disrupting Education? Experimental Evidence on Technology-Aided Instruction in India. American Economic Review, 109(4), 1426-1460. Downloaded copy: NBER Working Paper No. 22923 (Dec 2016, revised July 2017). https://doi.org/10.1257/aer.20171112 download
- Murphy, R., Gallagher, L., Krumm, A., Mislevy, J., & Hafter, A. (2014). Research on the Use of Khan Academy in Schools. Menlo Park, CA: SRI Education (funded by the Bill & Melinda Gates Foundation). https://www.sri.com/publication/education-learning-pubs/research-on-the-use-of-khan-academy-in-schools/ download
- Niederle, M. and Vesterlund, L. (2010). Explaining the Gender Gap in Math Test Scores: The Role of Competition. Journal of Economic Perspectives, 24(2), 129-144. https://doi.org/10.1257/jep.24.2.129 download
- Pekkarinen, T. (2014). Gender Differences in Strategic Behaviour under Competitive Pressure: Evidence on Omission Patterns in University Entrance Examinations. IZA Discussion Paper No. 8018. Published 2015 in the Journal of Economic Behavior & Organization. https://www.iza.org/publications/dp/8018 download
- Sahoo, S. and Klasen, S. (2021). Gender Segregation in Education: Evidence from Higher-Secondary Stream Choice in India. Demography, 58(3), 987-1010. Copy read: IZA Discussion Paper No. 11660 (2018), ‘Gender Segregation in Education and Its Implications for Labour Market Outcomes: Evidence from India’. https://doi.org/10.1215/00703370-9101395 download
- Sharma, S. and Sengupta, N. (2024). Debunking myths associated with affirmative action: using evidence from Supernumerary Seat Scheme. Working paper, IIT Delhi (presented at ACEGD 2024, ISI Delhi), 13 September 2024. https://www.isid.ac.in/~acegd/acegd2024/papers/SwatiSharma.pdf download
- Zakharov, A., Carnoy, M., & Loyalka, P. (2013). Which Teaching Practices Improve Student Performance on High-Stakes Exams? Evidence from Russia. HSE Basic Research Program Working Paper WP BRP 13/EDU/2013, National Research University Higher School of Economics. https://wp.hse.ru/data/2013/10/01/1278170826/13EDU2013.pdf download
- Dunlosky, J., Rawson, K. A., Marsh, E. J., Nathan, M. J., & Willingham, D. T. (2013). Improving students’ learning with effective learning techniques: promising directions from cognitive and educational psychology. Psychological Science in the Public Interest, 14(1), 4–58. https://doi.org/10.1177/1529100612453266 download
- Coffman, K. B., & Klinowski, D. (2020). The impact of penalties for wrong answers on the gender gap in test scores. PNAS, 117(16), 8794–8803. https://doi.org/10.1073/pnas.1920945117 download
- Ors, E., Palomino, F., & Peyrache, E. (2013). Performance gender gap: does competition matter? Journal of Labor Economics, 31(3), 443–499. https://doi.org/10.1086/669331 download
- Bowers, A. J., Sprott, R., & Taff, S. A. (2013). Do we know who will drop out? A review of the predictors of dropping out of high school: precision, sensitivity, and specificity. The High School Journal, 96(2), 77–100. https://doi.org/10.1353/hsj.2013.0000 download
- Bowers, A. J., & Zhou, X. (2019). Receiver operating characteristic (ROC) area under the curve (AUC): a diagnostic measure for evaluating the accuracy of predictors of education outcomes. Journal of Education for Students Placed at Risk, 24(1), 20–46. (Copy read: authors’ preprint.) https://doi.org/10.1080/10824669.2018.1523734 download