How many will clear JEE?

How many will clear JEE?
A calibrated forecast of JEE-Mains qualification for the current JNV Centre-of-Excellence cohorts: FY27 (Class 12) and FY28 (Class 11)
About this paper. This is an internal analysis by Avanti Fellows, shared for transparency. It has not been peer-reviewed. It was prepared with substantial help from AI tools (Anthropic’s Claude), which wrote much of the code and drafted much of the text under the direction of Avanti staff. The numbers are produced by code from the underlying data, and the sources and methods are documented so they can be checked, but errors are possible. Read the findings as preliminary, and contact Avanti Fellows before citing them.
Executive Summary
Section titled “Executive Summary”We forecast how many currently-enrolled JNV Centre-of-Excellence (CoE) students will qualify JEE Mains, for the two cohorts in the system today: FY27 (current Class 12, who sit JEE in 2027) and FY28 (current Class 11, who sit JEE in 2028). The forecast uses only what we know about these students now, their Grade-10 board marks and enrolment details, before any coaching-year performance exists. It is an early prior, to be refreshed as each cohort sits our own mock tests.
Last year’s real result was 467 of 507 CoE students qualifying (92%). For the current cohorts we project about 489 of 584 (84%) in FY27 and about 629 of 862 (73%) in FY28, with an 80% band of 78 to 89% for FY27 and 65 to 80% for FY28. The rate steps down because of who enrolled, not weaker teaching: the FY28 cohort is larger, leans more toward OBC and General students (who face the highest cutoffs), and includes several new centres with no prior record.
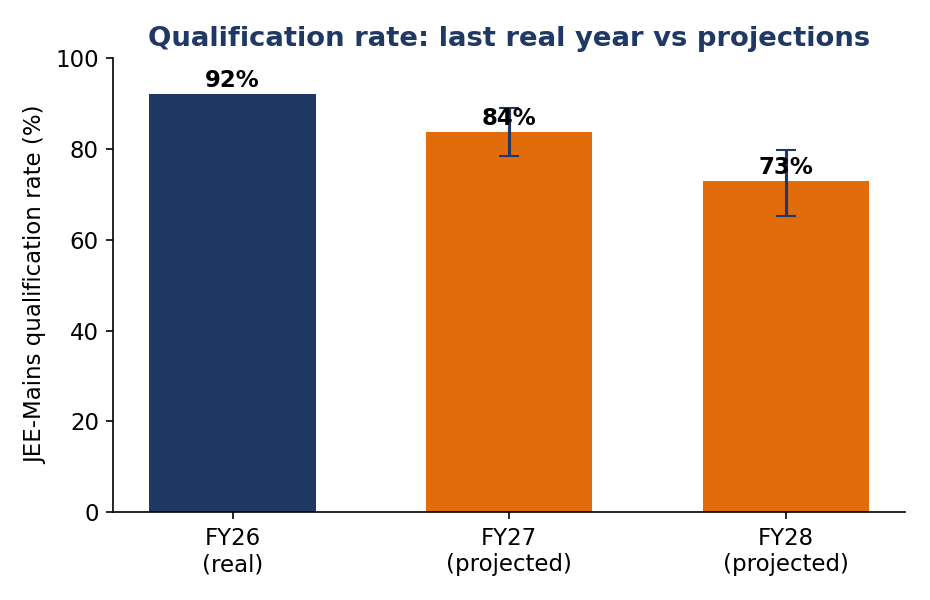
We do not label each student pass or fail. We fit a model on our own past CoE and Nodal students (n = 2,063 across 2024 to 2026, in 37 schools, each at their first JEE attempt), estimate each current student’s probability of clearing the cutoff for their category, and add the probabilities up. The band reflects the two things we do not yet know: the 2027 and 2028 cutoffs, and how a new cohort differs from past ones. On the honest test that applies to a forecast, hiding a full past cohort and predicting it as if unseen, the model is accurate on the pooled count (784 predicted against 782 actual on 886 students, an error of +0.3 points) but not on every single year: it under-predicted 2025 by 7 points and over-predicted 2026 by 5. Read any one year’s forecast as its band, not its point.
This edition corrects one issued earlier on 7 October (frozen in v3/), which reported 88%, 80% and 68%.
That run trained on 93 second JEE attempts by students who had already sat the exam once, after their time in
the programme, and it read the FY26 actuals from a golden record that dropped the NTA’s qualification flags.
Both are fixed here; Section 4.3 explains.
1. Abstract
Section titled “1. Abstract”We forecast JEE-Mains qualification for the two currently-enrolled JNV CoE cohorts, FY27 (Class 12) and FY28 (Class 11), from Grade-10 board marks and demographics. We fit a hierarchical distributional model of the JEE percentile on past JNV CoE and Nodal students at their first JEE attempt (n = 2,063; 886 CoE, 1,177 Nodal; 2024 to 2026; 37 school clusters). The outcome is modelled on the logit scale so predictions respect the 0 to 100 bound; the linear predictor is a quadratic in board marks interacted with a CoE indicator, plus category, gender, stream, and cohort fixed effects, with a school random intercept (estimated between-school variance 0.177, residual variance 0.926, intraclass correlation 0.16) and a between-cohort variance (0.060) that prices the unobserved future year. Each student’s predictive distribution yields a probability of clearing their category cutoff; the forecast is the sum of probabilities, with a Monte-Carlo band over the cutoff distribution and cohort transfer. We project about 489 of 584 qualifiers in FY27 (84%, band 78 to 89%) and about 629 of 862 in FY28 (73%, band 65 to 80%), against a real FY26 rate of 92% (467 of 507); the decline is cohort composition, not programme quality. In leave-one-cohort-out validation the model is well calibrated on the pooled count (predicted 784 against actual 782, error +0.3 points), but single held-out years miss by up to 7 points (2024 −2, 2025 −7, 2026 +5). The estimate is robust to board functional form; it leans on the school random effect (a genuine refit without it under-predicts by 2.7 points) and on borrowing strength from the lower-board Nodal sample (a shape donor, not a control group; dropping it under-predicts by 3.0 points). We do not forecast NIT-calibre (M1) scores from board data.
2. Introduction
Section titled “2. Introduction”Two cohorts sit in CoEs now. The current Class 12 sits JEE Mains in 2027 (FY27) and the current Class 11 sits it in 2028 (FY28). We want an early, defensible read on how many will qualify, per centre, that can be refreshed through the year rather than a single guess near the exam. The task is a forecast, not a causal estimate: we predict where these particular students are likely to land given what we observe now, and we carry no information from the coaching year, because none exists yet for these cohorts. The previewed result is 92% real in FY26, then 84% and 73% projected, with the fall driven by who enrolled.
3. Setting
Section titled “3. Setting”A Jawahar Navodaya Vidyalaya is a government residential school serving predominantly rural, reserved-category
students. Avanti runs a Centre of Excellence inside a subset of them: intensive, on-campus coaching for JEE and
NEET. A lighter-touch Nodal programme runs in other JNVs; in this model Nodal is not a comparison arm but a
shape donor, pooled in to estimate the board-to-outcome relationship in the low-board region CoE alone barely
populates (Section 5).
Qualifying JEE Mains means a national percentile at or above the cutoff for the student’s category. Cutoffs
differ sharply: in 2026, General 93.4, EWS 82.4, OBC 80.9, SC 63.9, ST 52.0 (percentiles; source
dim_nta_cutoffs). The same board ability therefore qualifies at very different rates across categories, which
is why category mix drives the headline.
4. Data
Section titled “4. Data”4.1 Sources and linkage
Section titled “4.1 Sources and linkage”The analysis reads the golden student record and BigQuery. Training outcomes and intake for past cohorts, and
the FY26 per-centre actuals, come from the golden record (JNV CoE and Nodal, 2024 to 2026), used after its
category-recovery fix, without which category was missing for the 2024 and 2025 CoE cohorts. Rosters,
demographics, centre, and Grade-10 board marks for the current cohorts come from dim_student; Class-11 board
gaps are filled from a de-identified marks file on the private bucket (student id plus marks, no personal data).
Category cutoffs come from dim_nta_cutoffs, taken across recent years so the cutoff enters as a distribution.
Two linkage details matter for the per-centre view: school names are canonicalised (upper-cased,
whitespace-collapsed) before grouping, since raw strings drift in case between sources and would otherwise
split a school’s random intercept into phantom half-weight clusters (10 such splits before the fix); and a
small centre-alias map assigns cohorts physically run out of another CoE (e.g. Burdwan’s cohort taught at JNV
Durgapur) to the centre that actually teaches them. The golden record spells the Prayagraj CoE “Allabahad”, and
the map folds that back too.
4.2 The forecast cohorts and coverage funnel
Section titled “4.2 The forecast cohorts and coverage funnel”| Cohort | Enrolled CoE | Engineering track | With a usable Grade-10 mark | Scored |
|---|---|---|---|---|
| FY27 (Class 12) | 716 | 618 | 584 | 584 |
| FY28 (Class 11) | 1,129 | 988 | 862 | 862 |
Students without a usable Grade-10 mark on record are left unscored, not assumed to fail. That is 34 FY27 and
126 FY28 engineering-track students; for FY28, 564 of the 862 marks come from the de-identified marks file
rather than dim_student.
4.3 The training sample
Section titled “4.3 The training sample”The model is fit on JNV CoE and Nodal students from 2024 to 2026 who sat JEE Mains and have a Grade-10 board mark, at their first JEE attempt. Since 22 July 2026 the golden record holds one row per student per exam attempt, so a student who sat JEE in 2025 and again in 2026 has a 2026 row carrying the second attempt. That attempt came after the student’s time in the programme, and it is not the outcome this model forecasts: its percentile beats the same student’s first attempt in 84 of 92 cases (median +9 points). We therefore keep each student’s earliest exam year, linking two golden ids that share an Avanti student id (799 students carry two), and drop the 93 later attempts in this sample; the FY26 actuals in Section 6.2 exclude them on the same rule. Left in, they cut the CoE coefficient from 1.13 to 0.86 and the FY28 forecast from 73% to 68%. The FY26 actuals also use the NTA’s qualification flags, which the golden record had been discarding until 7 October. The samples ledger, by cohort and programme:
| Cohort | CoE | Nodal | Total |
|---|---|---|---|
| 2024 | 71 | 463 | 534 |
| 2025 | 308 | 388 | 696 |
| 2026 | 507 | 326 | 833 |
| Total | 886 | 1,177 | 2,063 |
The CoE rows span three agencies: Avanti CoE in every year, Dakshana CoE in 2025 (201 of the 308) and ENF CoE in 2026 (104 of the 507). The 2,063 students sit in 37 schools (the clustering unit). Comparisons in the model are regression-adjusted, not matched or weighted; the Nodal arm enters to estimate the board-to-outcome shape, not as a causal control.
4.4 Variable definitions
Section titled “4.4 Variable definitions”pct: JEE-Mains national percentile (0 to 100), the outcome.board: mean of Grade-10 mathematics and science percentages;bis board centred at 85,b2its square.coe: 1 for a CoE agency (Avanti, Dakshana, ENF), 0 for Nodal.cat: category collapsed to SC, ST, OBC, EWS, GEN (PWD prefix stripped to its base).female: 1 if female.pcm: 1 if engineering stream.- A valid training row has a non-missing JEE percentile and board mark.
4.5 Balance: CoE versus Nodal (training sample)
Section titled “4.5 Balance: CoE versus Nodal (training sample)”This is not a treatment-versus-control contrast, and the table should not be read as one. CoE and Nodal are the two samples that jointly estimate one model (Section 5): Nodal enters with the CoE indicator off and contributes the shared board, category, gender and cohort structure, while the CoE-specific terms are identified off the CoE-minus-Nodal difference and only the CoE students are forecast. The table shows how the two samples differ so it is clear what each contributes. CoE students are higher-board; the lower-board Nodal sample populates the region CoE alone barely covers, and the model borrows that shape. The two are not balanced, as expected, since CoE selects on board marks.
| CoE (n=886) | Nodal (n=1,177) | Difference | |
|---|---|---|---|
| Board mean (SD) | 91.4 (7.3) | 83.7 (9.5) | +7.7 |
| % female | 36.3 | 40.1 | −3.8 |
| % General | 17.0 | 12.7 | +4.4 |
| % EWS | 9.0 | 6.4 | +2.7 |
| % OBC | 24.4 | 49.5 | −25.2 |
| % SC | 31.0 | 20.7 | +10.4 |
| % ST | 18.5 | 10.8 | +7.7 |
| Mean JEE percentile | 88.6 | 60.8 | +27.7 |
CoE students walk in about 8 board points higher and are more SC/ST and less OBC than Nodal. The raw JEE gap of 27.7 percentile points mixes this selection with any programme effect; because this is a forecast of CoE students (not a causal contrast), the model uses Nodal only to estimate the shared board-to-outcome shape, with a CoE level and slope on top.
4.6 CoE intake over the years
Section titled “4.6 CoE intake over the years”The forecast steps down (Section 6) because the intake changed, so the intake itself is the evidence. This is the CoE cohort characteristics across the three real years and the two forecast cohorts.
| Cohort | n | Board mean (SD) | % female | % Gen | % EWS | % OBC | % SC | % ST |
|---|---|---|---|---|---|---|---|---|
| 2024 (real) | 71 | 93.7 (5.0) | 63 | 11 | 14 | 21 | 30 | 24 |
| 2025 (real) | 308 | 90.1 (7.9) | 43 | 24 | 13 | 8 | 32 | 22 |
| 2026 (real) | 507 | 91.9 (7.1) | 29 | 13 | 6 | 35 | 30 | 16 |
| FY27 (proj.) | 584 | 89.8 (8.0) | 37 | 13 | 4 | 37 | 32 | 14 |
| FY28 (proj.) | 862 | 88.1 (7.3) | 45 | 14 | 6 | 53 | 18 | 9 |
Three shifts run together into FY28: the board mean falls to 88.1 (from 90 to 94 in the real years); the OBC share rises from between 8% and 35% to 53% while SC and ST fall, moving mass toward the higher OBC cutoff; and the female share is 45%, above the 29% to 43% of 2025 and 2026, which lowers the predicted rate because female is a negative predictor net of board and category (Section 5.3). (The 2024 cohort reads 63% female, but it is 71 students, a fifth the size of any later year.) The 2025 cohort is unusually General-heavy and OBC-light because two-thirds of it is Dakshana CoE. The FY28 cohort is also two-thirds larger than 2026, much of the growth in new centres (Section 6.2). Together these are the composition behind the 92 to 84 to 73 percent trend, not a change in teaching.
5. Empirical strategy
Section titled “5. Empirical strategy”5.1 Outcome transform
Section titled “5.1 Outcome transform”Let p = pct/100, clipped to [0.005, 0.995]. We model y = logit(p) = log(p/(1−p)). Mapping the bounded
percentile to the real line means predictions, when transformed back, always lie in (0, 100); the model cannot
emit an impossible percentile. It also makes a fixed additive effect on y a large percentile move in the
middle of the range and a small one near the ceiling, matching the fact that gaining ground at the 95th
percentile is far harder than at the 50th.
5.2 Estimating equation
Section titled “5.2 Estimating equation”For student i in school s(i) and cohort c,
y_ic = x_ic' β + u_s(i) + τ_c + ε_ic , u_s ~ N(0, σ²_school), ε_ic ~ N(0, σ²_resid).The fixed part x'β is b + b² + coe + coe·b + coe·b² + C(category) + female + pcm, with cohort fixed effects
τ_c. The CoE indicator is interacted with the board terms so the CoE relationship can differ in shape from
Nodal (heterogeneity in board). u_s is a school random intercept (partial pooling); its variance and the
residual variance are estimated jointly by restricted maximum likelihood (statsmodels MixedLM, L-BFGS).
5.3 Estimation and variance components
Section titled “5.3 Estimation and variance components”Fitted on the full training sample (n = 2,063, 37 schools):
| Component | Variance (logit) | SD (logit) |
|---|---|---|
| Residual | 0.926 | 0.96 |
| School random intercept | 0.177 | 0.42 |
| Between-cohort (transfer) | 0.060 | 0.24 |
The school intraclass correlation is 0.177 / (0.177 + 0.926) = 0.16: about a sixth of the residual variance in logit outcomes is between schools, which is why partial pooling on school matters and why small centres are shrunk toward the mean. The between-cohort variance is estimated from three cohort effects (two dummies plus the reference), so it is itself imprecise and is read as a floor on year-to-year uncertainty.
Key fixed effects (logit scale, coefficient [95% CI], p):
| Term | Coef [95% CI] | p |
|---|---|---|
board b |
+0.097 [0.089, 0.105] | 3e-137 |
board² b2 |
+0.0021 [0.002, 0.003] | 2e-14 |
coe (level) |
+1.134 [0.922, 1.345] | 9e-26 |
coe·b |
+0.014 [0.002, 0.026] | 0.024 |
coe·b² |
+0.0004 [−0.000, 0.001] | 0.34 |
female |
−0.476 [−0.571, −0.382] | 4e-23 |
| GEN (vs EWS) | −0.216 [−0.407, −0.024] | 0.027 |
| OBC (vs EWS) | −0.299 [−0.472, −0.125] | 7e-04 |
| SC (vs EWS) | −0.511 [−0.691, −0.329] | 3e-08 |
| ST (vs EWS) | −0.488 [−0.686, −0.290] | 1e-06 |
Board is a strong, precisely-estimated predictor. The CoE contribution is carried by a large level term (+1.13 logits, p < 1e-25). The linear CoE-by-board term is small but distinguishable from zero (+0.014 per board mark, p = 0.024): on the logit scale the CoE lift grows slightly with board, about +0.21 logits across a 15-mark range; the quadratic term is not (p = 0.34). On the percentile scale the lift is still largest for lower-scoring students, because of the logit link: percentiles crowd together near 100. The female coefficient (−0.48 logits, p < 1e-22) is a sizeable residual gender gap after conditioning on board and category. Category coefficients are on the latent percentile and are distinct from the cutoff each category faces; qualification combines both. Net of board marks, General students land somewhat below EWS (−0.22 logits, p = 0.027), but what separates their qualification rates is mainly the cutoff (93rd against 82nd percentile), not the latent score.
5.4 The predictive distribution
Section titled “5.4 The predictive distribution”For a student in a new cohort the predicted logit outcome is Normal, y* ~ N(μ*, σ*²), with
μ* = x*' β̂ + û_s (if the school was seen, else 0) + τ̄σ*² = σ²_resid + Var(τ) + σ²_school · 1{school unseen} + x*' Σ̂_β x*The mean adds the average cohort effect τ̄ because 2027 and 2028 are new draws. The variance sums four
sources: residual student-level variation, the between-cohort transfer, the school variance for centres with no
history, and parameter uncertainty in β̂.
One guard applies at prediction time. Because the fitted board² term is positive, the quadratic turns back up below a board of about 62, a region the training data barely covers (its 5th percentile is 69). A student below 69 is therefore scored as if at 69, which keeps the prediction monotone in board. It touches 16 FY27 and 17 FY28 students and moves the expected counts by under one qualifier (methodology note §3.2).
5.5 From a distribution to an expected count
Section titled “5.5 From a distribution to an expected count”Qualification is y* ≥ logit(c/100) for the category cutoff c, so P_i = Φ((μ* − logit(c/100)) / σ*). The
expected number of qualifiers is Σ_i P_i, the mean of a Poisson-binomial. This is the correct expectation of
the count, E[Σ 1{pct_i ≥ c}] = Σ P(pct_i ≥ c), and it retains the near-cutoff students that a point-threshold
would round to zero or one.
5.6 Uncertainty
Section titled “5.6 Uncertainty”The band is a 2,000-draw Monte-Carlo. Each draw takes a new-cohort shift δ ~ N(0, Var(τ)) and a cutoff per
category from the recent-year set, then recomputes the count as a Poisson-binomial realisation. The 10th, 50th
and 90th percentiles form the band, which is therefore dominated by the cutoff and the year-to-year shift, the
two quantities that actually move a count of students sitting near the line.
5.7 Identification and transport
Section titled “5.7 Identification and transport”A forecast rests on transport assumptions, not causal exchangeability. We fit in-population (same programme we
predict on), so no national relationship is assumed to carry over. We assume the intake-to-outcome mapping is
stable across cohorts up to the cohort shift τ_c, whose variance is in the band. Where a 2028 intake cell is
thin in the training data (the cohort is lower-board and more OBC than past CoE cohorts), the prediction leans
on the pooled shape including Nodal; the real uncertainty there is wider than the band conveys. The cutoff
enters only as the threshold, drawn from its recent distribution.
6. Results
Section titled “6. Results”6.1 The cohort trend
Section titled “6.1 The cohort trend”FY26 actual 92%, FY27 projected 84%, FY28 projected 73%. The decline is composition: lower board intake at several centres, a shift toward OBC and General/EWS students who face the highest cutoffs, and a large share of new centres with no record pulling the average toward the unproven middle.
6.2 Centre-by-centre panel
Section titled “6.2 Centre-by-centre panel”FY26 (real) against FY27 and FY28 (projected), in counts and rates, with the driver for each. Every centre is shown, including the new centres whose first CoE result comes in FY27 or FY28. A CoE with no history at its school carries no school effect: it is scored from the cohort’s own intake and the population relationship, with the school variance added to its uncertainty, so its band is wider than an established centre’s at the same rate. (A new CoE opened inside a school the model has seen — e.g. via its Nodal history — does inherit that school’s track record.) Cells read as qualifiers / scored (rate); n/a means no cohort in that year.
| Centre | FY26 (real) | FY27 (proj.) | FY28 (proj.) | Note |
|---|---|---|---|---|
| JNV Bundi CoE | 50/50 (100%) | 48/50 (97%) | 48/49 (98%) | more General/EWS (+25pp, top cutoff); more OBC (+29pp) |
| JNV Kottayam CoE | 49/50 (98%) | 47/50 (93%) | 42/48 (88%) | more General/EWS (+9pp, top cutoff); more OBC (+41pp) |
| JNV Adilabad CoE | 24/25 (96%) | 35/38 (92%) | 34/38 (91%) | weaker intake (board 93→91) |
| JNV Ujjain 2 CoE | n/a | n/a | 34/40 (85%) | new/low-history centre (no comparable FY26); small cohort — noisy |
| JNV Barwani CoE | 39/41 (95%) | 38/39 (98%) | 33/37 (89%) | weaker intake (board 93→91); more OBC (+33pp) |
| JNV Cuttack CoE | 37/40 (92%) | 34/39 (88%) | 29/39 (74%) | weaker intake (board 94→92); more General/EWS (+18pp, top cutoff); more OBC (+19pp) |
| JNV Puri CoE | n/a | n/a | 27/32 (86%) | new/low-history centre (no comparable FY26); small cohort — noisy |
| JNV Lucknow CoE | 38/38 (100%) | 36/38 (95%) | 25/33 (77%) | weaker intake (board 93→86); more General/EWS (+18pp, top cutoff); more OBC (+19pp) |
| JNV Wardha CoE | n/a | n/a | 25/33 (75%) | new/low-history centre (no comparable FY26); small cohort — noisy |
| JNV Nellore CoE | n/a | n/a | 24/40 (60%) | new/low-history centre (no comparable FY26); small cohort — noisy |
| JNV Thiruvananthapuram CoE | 17/31 (55%) | 8/18 (47%) | 24/39 (62%) | more General/EWS (+9pp, top cutoff) |
| JNV Kolhapur CoE | n/a | 30/38 (79%) | 24/32 (75%) | new/low-history centre (no comparable FY26) |
| JNV Karimnagar CoE | n/a | n/a | 24/36 (66%) | new/low-history centre (no comparable FY26); small cohort — noisy |
| JNV Kurnool CoE | 34/39 (87%) | 29/39 (75%) | 23/35 (66%) | weaker intake (board 94→89); more OBC (+46pp) |
| JNV Puducherry CoE | n/a | 26/40 (66%) | 23/40 (57%) | new/low-history centre (no comparable FY26) |
| JNV Mahisagar CoE | n/a | 20/27 (75%) | 22/32 (68%) | new/low-history centre (no comparable FY26) |
| JNV Vaishali CoE | n/a | n/a | 22/29 (75%) | new/low-history centre (no comparable FY26); small cohort — noisy |
| JNV Durgapur CoE | n/a | 30/35 (86%) | 22/39 (56%) | new/low-history centre (no comparable FY26) |
| JNV Palghar CoE | n/a | 33/40 (82%) | 19/27 (71%) | new/low-history centre (no comparable FY26) |
| JNV Nandurbar 2 CoE | n/a | n/a | 18/27 (68%) | new/low-history centre (no comparable FY26); small cohort — noisy |
| JNV Bangalore South CoE | n/a | n/a | 18/25 (72%) | new/low-history centre (no comparable FY26); small cohort — noisy |
| JNV Chandrapur CoE | n/a | n/a | 18/31 (58%) | new/low-history centre (no comparable FY26); small cohort — noisy |
| JNV Hassan CoE | 26/33 (79%) | 31/40 (77%) | 18/32 (55%) | weaker intake (board 93→85); more General/EWS (+13pp, top cutoff); more SC/ST (+13pp, lower bar) |
| JNV Kokrajhar CoE | 14/16 (88%) | 14/20 (71%) | 18/20 (87%) | stronger intake (board 83→90); more OBC (+26pp) |
| JNV Kohima CoE | 4/7 (57%) | 7/9 (79%) | 9/15 (58%) | new/low-history centre (no comparable FY26); small cohort — noisy |
| JNV Bellary CoE | n/a | n/a | 7/14 (48%) | new/low-history centre (no comparable FY26); small cohort — noisy |
| JNV Chandigarh CoE | 31/33 (94%) | 21/24 (86%) | n/a | no current cohort scored |
| JNV Ranchi CoE | 22/22 (100%) | n/a | n/a | no current cohort scored |
| JNV Nalanda CoE | 28/28 (100%) | n/a | n/a | no current cohort scored |
| JNV Varanasi CoE | 28/28 (100%) | n/a | n/a | no current cohort scored |
| JNV Prayagraj CoE | 26/26 (100%) | n/a | n/a | no current cohort scored |
Several centres are new this year and hold a large share of the FY28 cohort. They are the least certain part of the forecast, and they are part of why the FY28 average sits below FY26: established, high-performing centres are diluted by new ones still finding their feet.
6.3 By category
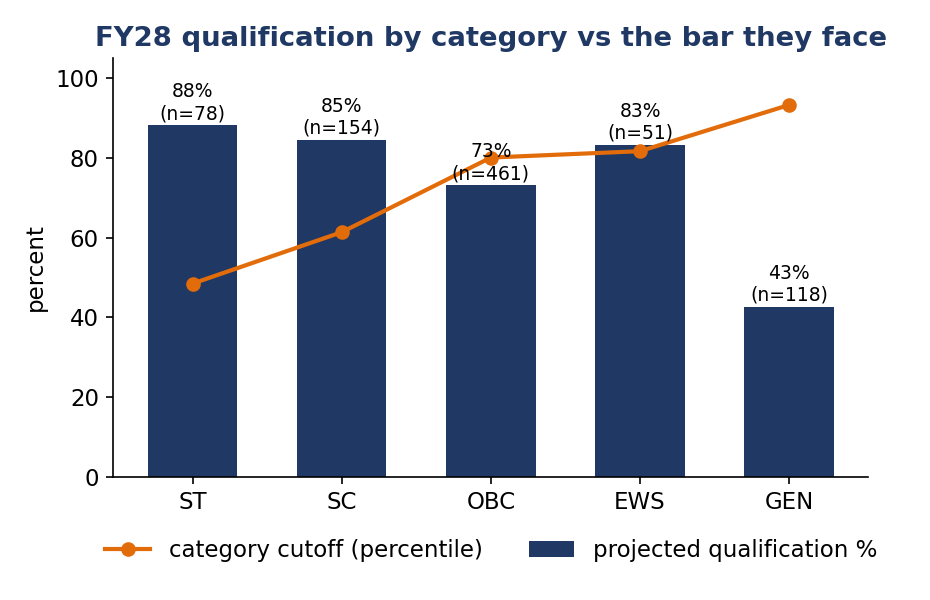
Section titled “6.3 By category”Qualification tracks the cutoff, not the board mark. Reserved categories face lower bars and clear at high rates; General has the highest board intake but the highest bar and the lowest projected rate (FY28):
| Category | n | Board mean | Cutoff (percentile) | Projected rate |
|---|---|---|---|---|
| ST | 78 | 85.1 | 48.5 | 88% |
| SC | 154 | 87.5 | 61.4 | 85% |
| OBC | 461 | 88.1 | 80.1 | 73% |
| EWS | 51 | 89.1 | 81.7 | 83% |
| General | 118 | 90.0 | 93.3 | 43% |
General students walk in with the highest board marks (90.0) yet clear least often, because their bar sits near the 93rd percentile. Read the General rate as the least reliable in the table: in the held-out check (Section 7) General is the category the model misses most, by about 20 points or more in both directions (optimistic in 2026, pessimistic in 2025). This is why the OBC-heavy FY28 mix lowers the headline: more students face the higher OBC and General bars.
6.4 The gender gap
Section titled “6.4 The gender gap”Splitting FY28 by gender exposes a large gap that intake does not explain:
| Boys | Girls | Difference | |
|---|---|---|---|
| n | 474 | 388 | −86 |
| Board mean | 88.7 | 87.3 | −1.4 |
| % General | 12.2 | 15.5 | +3.3 |
| % EWS | 7.2 | 4.4 | −2.8 |
| % OBC | 54.6 | 52.1 | −2.5 |
| % SC | 18.6 | 17.0 | −1.6 |
| % ST | 7.4 | 11.1 | +3.7 |
| Projected qualification rate | 80.8% | 63.4% | −17.4 pp |
Girls are projected to qualify 17.4 points below boys, while their board intake is only 1.4 points lower and
their category mix is similar. The gap is therefore the residual female effect in the model (a coefficient
of −0.48 on the logit scale, p < 1e-22; Section 5.3), estimated on past cohorts and net of board and category,
not a difference in what girls walk in with. This is a model projection, not an observed FY28 outcome, and it
matches the residual gender gap found in Avanti’s impact work. It is a flag for the girls-and-engineering
priority, and one the mock-test refresh should watch closely. It is also a large lever on the
headline: setting the residual female effect to zero (girls performing like boys with the same intake)
raises the FY28 expected count from 629 to about 674 (73% to 78%) and FY27 from 84% to 87%
(gain_scenarios.py, output/gender_counterfactual.csv) — more than half the entire coaching-gain
upside of Section 6.5.
6.5 The gain scenario: green, amber, red
Section titled “6.5 The gain scenario: green, amber, red”The centre panel above assumes each centre repeats its historical performance. The management question is
sharper: the programme aims to lift students 20–25 percentile points above their board-based baseline. In
the model, the gain a centre has historically delivered (the CoE lift plus that centre’s own school effect,
read at its median student) ranges across the established FY28 centres from about 6 to 29 percentile points,
mean 17, below that aim. gain_scenarios.py prices the gap: it shifts every centre’s performance one school-SD
(0.42 logits) below and above its central estimate, the natural unit of “a centre under-/over-delivering its
track record.”
At the cohort level: FY28 lands at 63% if the gain under-delivers everywhere, 73% central, 82% if it lands
consistently (FY27: 76 / 84 / 90). Per centre, against a 70% qualification bar (the July standard), this
classifies FY28 as 7 green (clear the bar even under-delivering), 7 amber (clear it only if the gain
lands), and 12 red (short even with a normal gain). FY27 is 10 green, 5 amber, 2 red. The amber and red lists, with each centre’s value-add versus its
intake, are in output/gain_scenarios_FY28.csv and drive the per-centre tiers in the donor-facing summary.
7. Validation
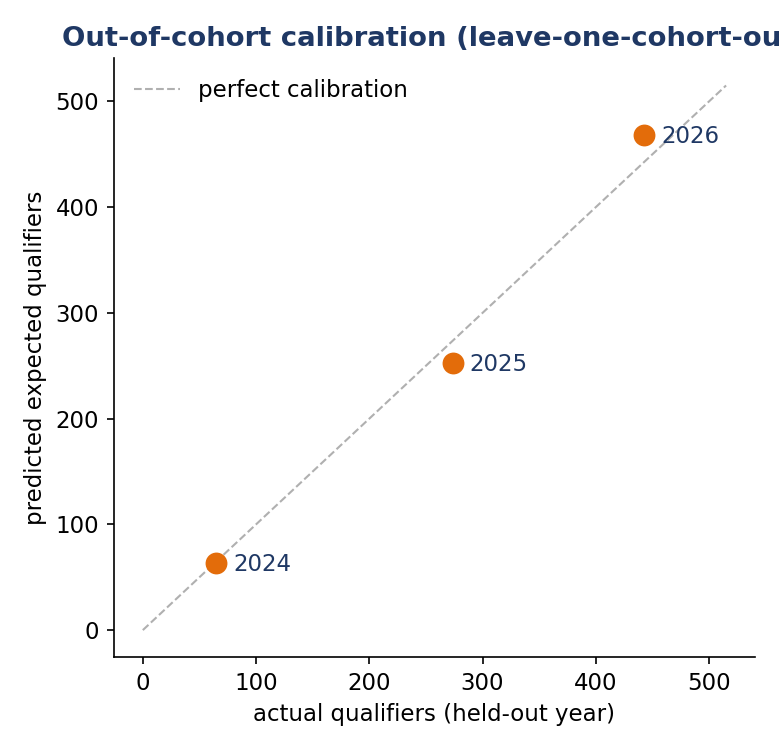
Section titled “7. Validation”We hold out one full past cohort, fit on the other two, and predict the held-out year as if unseen, the same
posture as forecasting 2027 or 2028. We score the predicted expected count against actual (calibration on the
count, the proper target for a count deliverable; classification accuracy on a batch where most students qualify
is inflated by the base rate). The same run scores calibration by category within each held-out year
(validate_loco.py): OBC, the category that decides FY28, is close in the largest held-out year (95% predicted
vs 91% actual, n = 175 in 2026). General is the category the model misses most, and not in one direction: 76%
predicted vs 51% actual in 2026 (n = 68), but 60% predicted vs 79% actual in 2025 (n = 75).
| Held-out cohort | n | Predicted | Actual | Error |
|---|---|---|---|---|
| 2024 | 71 | 63 (89%) | 65 (92%) | −2 pts |
| 2025 | 308 | 253 (82%) | 274 (89%) | −7 pts |
| 2026 | 507 | 468 (92%) | 443 (87%) | +5 pts |
| Pooled | 886 | 784 | 782 | +0.3 pts |
(The held-out “actual” counts a student as qualifying when their percentile clears that year’s category cutoff, so the 2026 figure, 443 of 507, differs from the FY26 panel’s 467, which uses the recorded qualification flag. Both have been reported this way since July.)
The pooled count is accurate, but single years are not: the errors offset. Neither year’s miss is spread evenly
across the cohort. The 2025 under-prediction sits in the Dakshana CoE students, two-thirds of that cohort
(170 predicted against 192 actual on 201, −11 points), while Avanti CoE in the same year is within a point. The
2026 over-prediction sits in Avanti CoE (369 against 345 on 403, +6 points), while ENF CoE is +1
(output/loco_validation_by_agency.csv). A 7-point year-level miss is as wide as the
half-width of the forecast bands (5 to 8 points either side of the FY27 and FY28 projections), which is why the
between-cohort variance is read as a floor (Section 9) and why any single year’s band should be read as, if
anything, too narrow.
8. Robustness
Section titled “8. Robustness”We re-run the leave-one-cohort-out validation under alternative specifications (robustness.py). Pooled
predicted against an actual 782 on 886 held-out CoE students:
| Specification | Predicted | Error |
|---|---|---|
| Main (quadratic board, Nodal borrow-strength, school RE) | 786 | +0.4 pts |
| Linear board (drop the quadratic) | 786 | +0.4 pts |
| No school random effect (plain OLS refit) | 758 | −2.7 pts |
| CoE-only (drop the Nodal borrow-strength) | 755 | −3.0 pts |
(The main row differs from Section 7 by two students because robustness.py re-implements the prediction for
every variant without the parameter-uncertainty term or the board floor; Section 7’s 784 is the figure we report.) The forecast is insensitive to the board functional form. It is not
insensitive to the school structure: a genuine refit without the random effect (plain OLS on the same fixed
effects, not merely zeroing the school term at prediction time) under-predicts by 2.7 points, which is evidence
the partial pooling earns its keep. And it leans on borrowing strength from Nodal: fitting on CoE students
alone, which have little mass in the low-board cells the future cohorts occupy, under-predicts by 3.0 points.
Both dependencies are smaller than in the July run (4.5 and 9.4 points), because the CoE sample is now larger
and spans more of the board range. They remain the reason both structures are in the model.
9. Limitations
Section titled “9. Limitations”- Board-only prior. No coaching-year signal exists yet for these cohorts. The mock-test refresh will be materially more accurate and will replace these numbers as that data arrives, rather than simply confirm them.
- Transfer variance from three cohorts. The between-cohort term that widens the band is estimated from three years; read it as a floor. Held-out single years have missed by up to 7 points (Section 7).
- New centres. With no history they carry no school effect and are scored from the population relationship; their real uncertainty is wider than the band conveys.
- Cutoffs. The 2027 and 2028 cutoffs are unknown; recent-year variation is in the band, but a surprise move would shift the count.
- NIT-calibre (M1) is not forecast from board data; it depends on mock-test performance and is deferred.
- Borrow-strength dependence. The estimate leans on the lower-board Nodal sample as a shape donor for the low-board cells (Section 8).
10. Conclusion
Section titled “10. Conclusion”For the students in CoEs today the board-based prior is 84% qualifying in FY27 and 73% in FY28, against a real 92% in FY26. The step down is who enrolled, not what the programme does. The estimate is calibrated on the pooled count where it can be tested, misses single years by up to 7 points, and is honest about the coaching-year lift it cannot yet see. The next read, once the cohorts have sat internal mocks, will fold that lift in and tighten the range.
11. Reproducibility
Section titled “11. Reproducibility”Every number here is reproducible. The model and analysis run from the scripts in the folder: model.py,
predict.py (forecast and centre panel), validate_loco.py (calibration), compare_linear.py (Section on the
linear comparison in the methodology note), robustness.py (Section 8), and stats.py (Section 4 and 5
statistics). A reviewer can reproduce the model, variance components, coefficients, validation and robustness
without warehouse access from the published de-identified training extract:
REPLICATION_CSV=training_deid.csv CUTOFFS_CSV=cutoffs_used.csv python3 stats.pyREPLICATION_CSV=training_deid.csv CUTOFFS_CSV=cutoffs_used.csv python3 validate_loco.pyThe forward forecast (predict.py) additionally needs the live roster from BigQuery, which cannot be
distributed. Figures regenerate with make_figs.py.
Replication data
Section titled “Replication data”Aggregate or de-identified, no names, dates of birth, or re-identifying ids:
- training_deid.csv, the row-level training sample (n = 2,126 CoE+Nodal appearers at their first JEE attempt; 2,063 with a board mark; school hashed) behind every model estimate, variance component, coefficient, and the validation
- cutoffs_used.csv, the category cutoffs by year
- centre_panel.csv, the full FY26, FY27, FY28 centre panel with drivers
- per_student_deid.csv, per-student board, category, centre, and predicted probability for the current cohorts (de-identified)
- gain_scenarios_FY28.csv (and FY27), the per-centre gain scenarios and green/amber/red tiers of Section 6.5
- loco_validation.csv, loco_validation_by_cat.csv and loco_validation_by_agency.csv, the Section 7 calibration
- The July 2026 version of this paper, with its outputs, is frozen in v2/; the 7 October morning version (trained on repeat attempts) in v3/
- Methodology and the linear-model comparison: methodology.md